RBS 2008 Annual Report Download - page 71
Download and view the complete annual report
Please find page 71 of the 2008 RBS annual report below. You can navigate through the pages in the report by either clicking on the pages listed below, or by using the keyword search tool below to find specific information within the annual report.-
 1
1 -
2
-
3
-
4
-
5
-
6
-
7
-
8
-
9
-
10
-
11
-
12
-
13
-
14
-
15
-
16
-
17
-
18
-
19
-
20
-
21
-
22
-
23
-
24
-
25
-
26
-
27
-
28
-
29
-
30
-
31
-
32
-
33
-
34
-
35
-
36
-
37
-
38
-
39
-
40
-
41
-
42
-
43
-
44
-
45
-
46
-
47
-
48
-
49
-
50
-
51
-
52
-
53
-
54
-
55
-
56
-
57
-
58
-
59
-
60
-
 61
61 -
 62
62 -
 63
63 -
 64
64 -
 65
65 -
 66
66 -
 67
67 -
 68
68 -
 69
69 -
 70
70 -
 71
71 -
 72
72 -
 73
73 -
 74
74 -
 75
75 -
 76
76 -
 77
77 -
 78
78 -
 79
79 -
 80
80 -
 81
81 -
82
-
83
-
84
-
85
-
86
-
87
-
88
-
89
-
90
-
91
-
92
-
93
-
94
-
95
-
96
-
97
-
98
-
99
-
100
-
101
-
102
-
103
-
104
-
105
-
106
-
107
-
108
-
109
-
110
-
111
-
112
-
113
-
114
-
115
-
116
-
117
-
118
-
119
-
120
-
121
-
122
-
123
-
124
-
125
-
126
-
127
-
128
-
129
-
130
-
131
-
132
-
133
-
134
-
135
-
136
-
137
-
138
-
139
-
140
-
141
-
142
-
143
-
144
-
145
-
146
-
147
-
148
-
149
-
150
-
151
-
152
-
153
-
154
-
155
-
156
-
157
-
158
-
159
-
160
-
161
-
162
-
163
-
164
-
165
-
166
-
167
-
168
-
169
-
170
-
171
-
172
-
173
-
174
-
175
-
176
-
177
-
178
-
179
-
180
-
181
-
182
-
183
-
184
-
185
-
186
-
187
-
188
-
189
-
190
-
191
-
192
-
193
-
194
-
195
-
196
-
197
-
198
-
199
-
200
-
201
-
202
-
203
-
204
-
205
-
206
-
207
-
208
-
209
-
210
-
211
-
212
-
213
-
214
-
215
-
216
-
217
-
218
-
219
-
220
-
221
-
222
-
223
-
224
-
225
-
226
-
227
-
228
-
229
-
230
-
231
-
232
-
233
-
234
-
235
-
236
-
237
-
238
-
239
-
240
-
241
-
242
-
243
-
244
-
245
-
246
-
247
-
248
-
249
-
250
-
251
-
252
-
253
-
254
-
255
-
256
-
257
-
258
-
259
-
260
-
261
-
262
-
263
-
264
-
265
-
266
-
267
-
268
-
269
-
270
-
271
-
272
-
273
-
274
-
275
-
276
-
277
-
278
-
279
-
280
-
281
-
282
-
283
-
284
-
285
-
286
-
287
-
288
-
289
-
290
-
291
-
292
-
293
-
294
-
295
-
296
-
297
-
298
-
299
 |
 |

RBS Group Annual Report and Accounts 200870
Business review continued
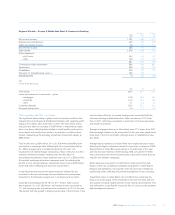
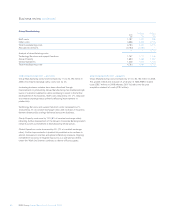
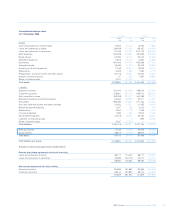
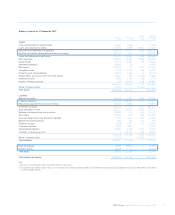
Overview of condensed consolidated balance sheet – pro forma
Total assets of £2,218.7 billion at 31 December 2008 were up £623.6
billion, 39%, compared with 31 December 2007. At constant exchange
rates the increase was £313 billion or 16%.
Loans and advances to banks decreased by £81.6 billion, 39%, to
£129.4 billion. Reverse repurchase agreements and stock borrowing
(‘reverse repos’) were down by £115.7 billion, 66% to £58.8 billion.
Excluding reverse repos, bank placings increased by £34.1 billion,
93%, to £70.6 billion.
Loans and advances to customers were up £31.0 billion, 4%, at £731.2
billion. Within this, reverse repos decreased by 72%, £102.8 billion to
£39.3 billion. Excluding reverse repos, lending rose by £133.8 billion,
24% to £691.9 billion reflecting both organic growth of £44.8 billion, 7%
and the effect of exchange rate movements of £89.0 billion following the
weakening of sterling during the second half of 2008.
Debt securities increased by £12.3 billion, 5%, to £253.1 billion and
equity shares decreased by £24.6 billion, 53%, to £22.1 billion
principally due to changes in Global Banking & Markets.
Movements in the value of derivatives, assets and liabilities, primarily
reflect changes in interest and exchange rates, together with an 7%
growth in trading volumes on a constant currency basis.
Intangible assets declined by £11.2 billion, 41% to £16.4 billion,
reflecting an impairment of £16.9 billion partially offset by exchange
rate movements of £5.7 billion and goodwill of £0.2 billion arising on the
Sempra joint venture.
Deferred tax assets increased £3.7 billion, to £5.4 billion principally due
to carried forward trading losses.
Prepayments, accrued income and other assets were up £4.1 billion,
25% to £20.7 billion.
Deposits by banks declined by £41.6 billion, 14% to £261.9 billion. This
reflected decreased repurchase agreements and stock lending
(‘repos’), down £78.2 billion, 48% to £83.7 billion partly offset by
increased inter-bank deposits, up £36.6 billion, 26% to £178.3 billion.
Customer accounts were down £38.7 billion, 7% to £518.5 billion. Within
this, repos decreased £61.9 billion, 52% to £58.1 billion. Excluding
repos, deposits rose by £23.3 billion, 5%, to £460.3 billion.
Settlement balances and short positions were down £35.6 billion, 40%,
to £54.3 billion reflecting reduced customer activity.
Accruals, deferred income and other liabilities decreased £4.4 billion,
16%, to £23.5 billion.
Retirement benefit liabilities increased £1.3 billion to £1.5 billion due to
reduced asset values only partly offset by the effect of increased
discount rates.
Deferred taxation liabilities decreased by £0.8 billion, 21% to £2.9 billion
due in part to the sale of Angel Trains.
Subordinated liabilities were up £15.6 billion, 56% to £43.7 billion
reflecting the issue of £2.0 billion dated loan capital, the allocation of
£6.5 billion ABN AMRO subordinated liabilities from consortium shared
assets, and the effect of exchange rate and other adjustments, £8.1 billion,
partially offset by the redemption of £1.0 billion of dated loan capital.
Equity minority interests increased by 1% to £5.4 billion. Attributable
profits of £0.4 billion, £0.8 billion equity raised as part of the Sempra
joint venture and other equity raised, £0.3 billion, and the effect of
exchange rate movements of £1.2 billion were partially offset by equity
withdrawals of £0.9 billion, reductions in the market value of available-
for-sale securities of £1.3 billion in respect of the investment in Bank
of China attributable to minority shareholders, and dividends paid of
£0.3 billion.
Owners’ equity increased by £5.8 billion, 11% to £58.9 billion. Net
proceeds of £12.0 billion from the rights issue, and net proceeds of
£19.7 billion from the placing and open offer, together with exchange
rate movements of £6.8 billion were partially offset by the attributable
loss for the period of £23.5 billion, a £4.6 billion decrease in available-
for-sale reserves, net of tax, reflecting £1.0 billion in the Group’s share
in the investment in Bank of China and £3.6 billion in other securities,
the majority of which related to Global Banking & Markets, actuarial
losses net of tax of £1.3 billion, the payment of the 2007 final ordinary
dividend of £2.3 billion and other dividends of £0.6 billion, and a
reduction in the cash flow hedging reserve of £0.3 billion.
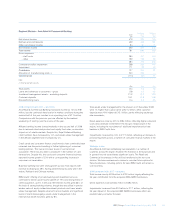
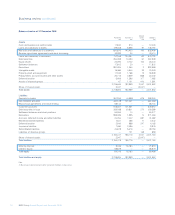
Overview of consolidated balance sheet – statutory
Total assets of £2,401.7 billion at 31 December 2008 were up £560.8
billion, 30%, compared with 31 December 2007.
Loans and advances to banks decreased by £81.3 billion, 37%, to
£138.2 billion. Reverse repurchase agreements and stock borrowing
(‘reverse repos’) were down by £117.2 billion, 67% to £58.8 billion.
Excluding reverse repos, bank placings increased by £35.9 billion,
83%, to £79.4 billion.
Loans and advances to customers were up £46.2 billion, 6%, at £874.7
billion or £68.0 billion, 8% following the disposal of the Banco Real and
other businesses to Santander and Tesco Personal Finance. Within this,
reverse repos decreased by 72%, £103.0 billion to £39.3 billion.
Excluding reverse repos, lending rose by £149.2 billion, 22% to £835.4
billion reflecting both organic growth and the effect of exchange rate
movements following the weakening of sterling during the second half
of 2008.
Debt securities decreased by £27.1 billion, 9%, to £267.5 billion and
equity shares decreased by £26.7 billion, 50%, to £26.3 billion
principally due to lower holdings in Global Banking & Markets.