RBS 2008 Annual Report Download - page 38
Download and view the complete annual report
Please find page 38 of the 2008 RBS annual report below. You can navigate through the pages in the report by either clicking on the pages listed below, or by using the keyword search tool below to find specific information within the annual report.-
 1
1 -
2
-
3
-
4
-
5
-
6
-
7
-
8
-
9
-
10
-
11
-
12
-
13
-
14
-
15
-
16
-
17
-
18
-
19
-
20
-
21
-
22
-
23
-
24
-
25
-
26
-
27
-
 28
28 -
 29
29 -
 30
30 -
 31
31 -
 32
32 -
 33
33 -
 34
34 -
 35
35 -
 36
36 -
 37
37 -
 38
38 -
 39
39 -
 40
40 -
 41
41 -
 42
42 -
 43
43 -
 44
44 -
 45
45 -
 46
46 -
 47
47 -
 48
48 -
49
-
50
-
51
-
52
-
53
-
54
-
55
-
56
-
57
-
58
-
59
-
60
-
61
-
62
-
63
-
64
-
65
-
66
-
67
-
68
-
69
-
70
-
71
-
72
-
73
-
74
-
75
-
76
-
77
-
78
-
79
-
80
-
81
-
82
-
83
-
84
-
85
-
86
-
87
-
88
-
89
-
90
-
91
-
92
-
93
-
94
-
95
-
96
-
97
-
98
-
99
-
100
-
101
-
102
-
103
-
104
-
105
-
106
-
107
-
108
-
109
-
110
-
111
-
112
-
113
-
114
-
115
-
116
-
117
-
118
-
119
-
120
-
121
-
122
-
123
-
124
-
125
-
126
-
127
-
128
-
129
-
130
-
131
-
132
-
133
-
134
-
135
-
136
-
137
-
138
-
139
-
140
-
141
-
142
-
143
-
144
-
145
-
146
-
147
-
148
-
149
-
150
-
151
-
152
-
153
-
154
-
155
-
156
-
157
-
158
-
159
-
160
-
161
-
162
-
163
-
164
-
165
-
166
-
167
-
168
-
169
-
170
-
171
-
172
-
173
-
174
-
175
-
176
-
177
-
178
-
179
-
180
-
181
-
182
-
183
-
184
-
185
-
186
-
187
-
188
-
189
-
190
-
191
-
192
-
193
-
194
-
195
-
196
-
197
-
198
-
199
-
200
-
201
-
202
-
203
-
204
-
205
-
206
-
207
-
208
-
209
-
210
-
211
-
212
-
213
-
214
-
215
-
216
-
217
-
218
-
219
-
220
-
221
-
222
-
223
-
224
-
225
-
226
-
227
-
228
-
229
-
230
-
231
-
232
-
233
-
234
-
235
-
236
-
237
-
238
-
239
-
240
-
241
-
242
-
243
-
244
-
245
-
246
-
247
-
248
-
249
-
250
-
251
-
252
-
253
-
254
-
255
-
256
-
257
-
258
-
259
-
260
-
261
-
262
-
263
-
264
-
265
-
266
-
267
-
268
-
269
-
270
-
271
-
272
-
273
-
274
-
275
-
276
-
277
-
278
-
279
-
280
-
281
-
282
-
283
-
284
-
285
-
286
-
287
-
288
-
289
-
290
-
291
-
292
-
293
-
294
-
295
-
296
-
297
-
298
-
299
 |
 |

37RBS Group Annual Report and Accounts 2008
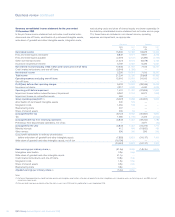
2008 compared with 2007 – pro forma
Profit
Group operating profit, excluding credit market write-downs and one-off
items, impairment losses on reclassified assets, amortisation of
purchased intangible assets, write-down of goodwill and other
intangible assets, integration costs, restructuring costs and share of
shared assets, was £80 million, compared with a profit of £10,314
million in 2007. The reduction is primarily a result of a substantial
decline in non-interest income, a number of specific losses such as
counterparty failures, and a marked increase in the credit impairment
charge, reflecting weakness in financial markets and a deteriorating
global economy.
Losses from previously disclosed credit market exposures increased to
£7,781 million, compared with £2,387 million in 2007, with the great
majority incurred in the first half of the year. Other one-off items
amounted to a credit of £1,674 million, 23% higher than in 2007,
principally as a result of a £1,232 million increase in the carrying value
of own debt carried at fair value. After integration costs, restructuring
costs, amortisation of purchased intangibles, write-down of goodwill
and other intangible assets and share of shared assets, the Group
recorded a loss before tax of £25,038 million, compared with a profit
before tax of £8,962 million in 2007.
After tax, minority interests and preference share dividends, the loss
attributable to ordinary shareholders was £24,051 million, compared
with an attributable profit of £6,823 million in 2007.
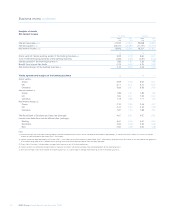
Total income
Total income, excluding credit market write-downs and one-off items,
declined by 20% to £26,875 million, with a significant deterioration
experienced during the second half of the year principally as a result of
£5.8 billion of trading asset write-downs, counterparty failure and
incremental reserving within GBM. While income increased in 2008 in
Global Transaction Services, and held steady in Regional Markets and
Insurance, a significant reduction occurred in Global Banking &
Markets, where a strong performance in rates, currencies and
commodities was offset by marked deterioration in credit markets and
equities.
Net interest income
Net interest income increased by 29% to £15,939 million, with average
loans and advances to customers up 17% and average customer
deposits up 6%. Group net interest margin rose from 2.00% to 2.10%
largely reflecting the success of the rates business in a declining
interest rate environment. However, margins tightened within Regional
Markets as market interest rates fell, with deposit markets remaining
competitive and price adjustments on lending taking some time to feed
through to the back book.
Non-interest income
Non-interest income was severely affected by the weakness in financial
markets experienced over the course of the year, particularly in the
fourth quarter. Excluding credit market write-downs and one-off items,
non-interest income totalled £10,936 million, 48% lower than in 2007.
While the decline was particularly marked in GBM’s credit markets and
equities businesses, with reduced business volumes and mounting
mark-to-market trading losses, Regional Markets also saw non-interest
income fall in the latter part of the year as declining consumer
confidence led to lower demand for credit and other financial products.
Operating expenses
Total operating expenses were reduced by 4% to £15,916 million, with
cost growth in the Group’s core retail and commercial banking
franchises offset by efficiency programmes and a significant reduction
in Global Banking & Markets staff costs. The Group cost:income ratio
deteriorated to 59.2%, compared with 49.5% in 2007, largely reflecting
the impact on income of the year’s difficult market conditions.
Net insurance claims
Net insurance claims fell by 13% to £3,917 million. General insurance
claims fell by 7%, reflecting improved risk selection, better claims
management and the non-recurrence of the severe floods experienced
in 2007. Bancassurance claims declined by 64% as a result of
movements in financial market values.
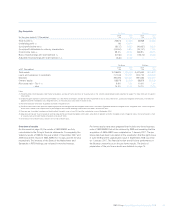
Impairment losses
Credit impairment losses (excluding reclassified assets) increased to
£6,962 million in 2008, compared with £2,104 million in 2007. The Group
experienced a pronounced deterioration in impairments in the second
half of the year, as financial stress spread to a broad range of
customers. The greatest increase in impairments occurred in GBM,
where fourth quarter impairments totalled £2,938 million, including a
loss of approximately £900 million on the Group’s exposure to
LyondellBasell. However, the Regional Markets businesses in all
geographies also experienced a noticeable increase in impairments in
the second half, particularly in the UK and Irish corporate and US
personal segments.
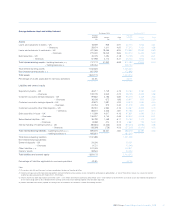
Impairments represented 0.46% of gross loans and advances, excluding
reverse repos, in the first half but reached 1.41% in the second half. For
2008 as a whole, impairments amounted to 0.91% of loans and
advances, excluding reverse repos, compared with 0.37% in 2007.
Risk elements in lending and potential problem loans at 31 December
2008 represented 2.69% of loans and advances, excluding reverse
repos, compared with 1.49% a year earlier. Provision coverage was
50%, compared with 59% at 31 December 2007 reflecting the higher
proportion of secured loans included in risk elements in lending and
potential problem loans.
Credit market losses
Losses for 2008 relating to the Group’s previously identified credit
market exposures totalled £7,781 million, net of hedging gains of
£1,642 million. This includes impairment losses of £466 million incurred
on credit market assets reclassified out of the ‘held-for-trading’ category
in line with the amendments to IAS 39 ‘Financial Instruments:
Recognition and Measurement’ issued in October. While the majority of
these write-downs were incurred in the first half of 2008, the severity of
the financial market dislocation intensified in the fourth quarter, resulting
in further losses in particular on the Group’s structured credit portfolios.