RBS 2008 Annual Report Download - page 207
Download and view the complete annual report
Please find page 207 of the 2008 RBS annual report below. You can navigate through the pages in the report by either clicking on the pages listed below, or by using the keyword search tool below to find specific information within the annual report.-
 1
1 -
2
-
3
-
4
-
5
-
6
-
7
-
8
-
9
-
10
-
11
-
12
-
13
-
14
-
15
-
16
-
17
-
18
-
19
-
20
-
21
-
22
-
23
-
24
-
25
-
26
-
27
-
28
-
29
-
30
-
31
-
32
-
33
-
34
-
35
-
36
-
37
-
38
-
39
-
40
-
41
-
42
-
43
-
44
-
45
-
46
-
47
-
48
-
49
-
50
-
51
-
52
-
53
-
54
-
55
-
56
-
57
-
58
-
59
-
60
-
61
-
62
-
63
-
64
-
65
-
66
-
67
-
68
-
69
-
70
-
71
-
72
-
73
-
74
-
75
-
76
-
77
-
78
-
79
-
80
-
81
-
82
-
83
-
84
-
85
-
86
-
87
-
88
-
89
-
90
-
91
-
92
-
93
-
94
-
95
-
96
-
97
-
98
-
99
-
100
-
101
-
102
-
103
-
104
-
105
-
106
-
107
-
108
-
109
-
110
-
111
-
112
-
113
-
114
-
115
-
116
-
117
-
118
-
119
-
120
-
121
-
122
-
123
-
124
-
125
-
126
-
127
-
128
-
129
-
130
-
131
-
132
-
133
-
134
-
135
-
136
-
137
-
138
-
139
-
140
-
141
-
142
-
143
-
144
-
145
-
146
-
147
-
148
-
149
-
150
-
151
-
152
-
153
-
154
-
155
-
156
-
157
-
158
-
159
-
160
-
161
-
162
-
163
-
164
-
165
-
166
-
167
-
168
-
169
-
170
-
171
-
172
-
173
-
174
-
175
-
176
-
177
-
178
-
179
-
180
-
181
-
182
-
183
-
184
-
185
-
186
-
187
-
188
-
189
-
190
-
191
-
192
-
193
-
194
-
195
-
196
-
 197
197 -
 198
198 -
 199
199 -
 200
200 -
 201
201 -
 202
202 -
 203
203 -
 204
204 -
 205
205 -
 206
206 -
 207
207 -
 208
208 -
 209
209 -
 210
210 -
 211
211 -
 212
212 -
 213
213 -
 214
214 -
 215
215 -
 216
216 -
 217
217 -
218
-
219
-
220
-
221
-
222
-
223
-
224
-
225
-
226
-
227
-
228
-
229
-
230
-
231
-
232
-
233
-
234
-
235
-
236
-
237
-
238
-
239
-
240
-
241
-
242
-
243
-
244
-
245
-
246
-
247
-
248
-
249
-
250
-
251
-
252
-
253
-
254
-
255
-
256
-
257
-
258
-
259
-
260
-
261
-
262
-
263
-
264
-
265
-
266
-
267
-
268
-
269
-
270
-
271
-
272
-
273
-
274
-
275
-
276
-
277
-
278
-
279
-
280
-
281
-
282
-
283
-
284
-
285
-
286
-
287
-
288
-
289
-
290
-
291
-
292
-
293
-
294
-
295
-
296
-
297
-
298
-
299
 |
 |

Notes on the accounts continued
RBS Group Annual Report and Accounts 2008206
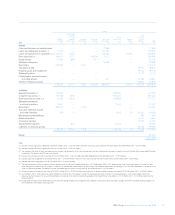
11 Financial instruments (continued)
Where these instruments have embedded optionality it is valued using a
variation of the Black-Scholes option pricing formula, and where they
have correlation exposure it is valued using a variant of the Gaussian
Copula model. The volatility or unique correlation inputs required to
value these products are generally unobservable and the instruments
are therefore deemed to be level 3 instruments.
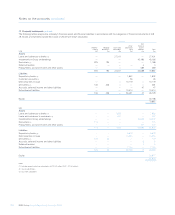
Other derivatives
Exotic equity, interest rate and commodity options provide a payout (or
series of payouts) linked to the performance of one or more underlying,
including equities, interest rates, foreign exchange rates and
commodities. Included in commodities derivatives are energy contracts
entered into by RBS Sempra Commodities. Most of these contracts are
valued using models that incorporate observable data. A small number
are more complex, structured derivatives which incorporate in their
valuation assumptions regarding power price volatilities and correlation
between inputs, which are not market observable. These include certain
tolling agreements, where power is purchased in return for a given
quantity of fuel, and load deals, where a seller agrees to deliver a fixed
proportion of power used by a client’s utility customers.
Exotic options do not trade in active markets except in a small number
of cases. Consequently, the Group uses models to determine fair value
using valuation techniques typical for the industry. These techniques
can be divided, firstly, into modelling approaches and, secondly, into
methods of assessing appropriate levels for model inputs. The Group
uses a variety of proprietary models for valuing exotic trades.
Exotic valuation inputs include correlation between equities, interest
rates, foreign exchange rates and commodity prices. Correlations for
more liquid equity and rate pairs are valued using independently
sourced consensus pricing levels. Where a consensus pricing
benchmark is unavailable, these instruments are categorised as level 3.
Reasonably possible alternative assumptions
In determining the effect of reasonably possible alternative assumptions
for unobservable inputs, the Group has considered credit derivative
trades with CDPCs separately from all other level 3 derivatives due to
the significant element of subjectivity in determining the counterparty
credit risk.
The fair value of credit derivative trades with CDPCs as at 31 December
2008 was £4.8 billion before applying a CVA of £1.3 billion. The Group’s
credit derivative exposures to CDPCs are valued using pricing models
with inputs observed directly in the market. An adjustment is made to
the model valuation as the creditworthiness of CDPC counterparties
differs from that of the credit risk assumptions used in the model. The
adjustment reflects the estimated cost of hedging the counterparty risk
arising from each trade. In the absence of market observable credit
spreads of CDPCs, the cost of hedging the counterparty risk is
estimated from an analysis of the underlying trades and the cost of
hedging expected default losses in excess of the capital available in
each vehicle. A reasonably possible alternative approach would be to
estimate the cost of hedging the counterparty risk from market
observable credit spreads of entities considered similar to CDPCs (for
example monoline insurers with similar business or similarly rated
entities). These reasonably possible alternative approaches would
reduce the fair value credit derivatives with CDPCs by up to £740 million
or increase the fair value by up to £600 million.
For all other level 3 derivatives, unobservable inputs are principally
comprised of correlations and volatilities. Where a derivative valuation
relies significantly on an unobservable input, the valuation is shown in
level 3. It is usual for such derivative valuations to depend on several
observable, and one or few unobservable model inputs. In determining
reasonably possible alternative assumptions, the relative impact of
unobservable inputs as compared to those which may be observed
was considered. Using reasonably possible alternative assumptions the
fair value of all other level 3 derivative assets (excluding CDPCs) would
be reduced by up to £600 million or increased by up to £560 million and
derivative liabilities of £4.0 billion, would be reduced by up to £300
million or increased by upto £280 million.
Equity shares – private equity
Private equity investments include unit holdings and limited partnership
interests primarily in corporate private equity funds, debt funds and fund
of hedges funds. Externally managed funds are valued using recent
prices where available. Where not available, the fair value of
investments in externally managed funds is generally determined using
statements or other information provided by the fund managers.
Although such valuations are provided from third parties, the Group
recognises that such valuations may rely significantly on the judgements
and estimates made by those fund managers, particularly in assessing
private equity components. Following the decline in liquidity in world
markets, the Group believes that there is sufficient subjectivity in such
valuations to report them in level 3.
Reasonably possible alternative valuations have been determined based
on the historic trends in valuations received, and by considering the
possible impact of market movements towards the end of the reporting
period, which may not be fully reflected in valuations received. Using
these reasonably possible alternate assumptions would reduce the fair
value of externally managed funds of £1.1 billion by up to £160 million
or increase the fair value by up to £80 million.
Other financial instruments
Other than the portfolios discussed above, there are other financial
instruments which are held at fair value determined from data which are
not market observable, or incorporating material adjustments to market
observed data. Using reasonably possible alternate assumptions
appropriate to the liability in question, such as credit spreads, derivative
inputs and equity correlations, would reduce the fair value of other
financial instruments held at fair value of £5.0 billion, primarily debt
securities in issue of £4.4 billion, by up to £250 million or increase the
fair value by up to £210 million.