RBS 2008 Annual Report Download - page 290
Download and view the complete annual report
Please find page 290 of the 2008 RBS annual report below. You can navigate through the pages in the report by either clicking on the pages listed below, or by using the keyword search tool below to find specific information within the annual report.-
 1
1 -
2
-
3
-
4
-
5
-
6
-
7
-
8
-
9
-
10
-
11
-
12
-
13
-
14
-
15
-
16
-
17
-
18
-
19
-
20
-
21
-
22
-
23
-
24
-
25
-
26
-
27
-
28
-
29
-
30
-
31
-
32
-
33
-
34
-
35
-
36
-
37
-
38
-
39
-
40
-
41
-
42
-
43
-
44
-
45
-
46
-
47
-
48
-
49
-
50
-
51
-
52
-
53
-
54
-
55
-
56
-
57
-
58
-
59
-
60
-
61
-
62
-
63
-
64
-
65
-
66
-
67
-
68
-
69
-
70
-
71
-
72
-
73
-
74
-
75
-
76
-
77
-
78
-
79
-
80
-
81
-
82
-
83
-
84
-
85
-
86
-
87
-
88
-
89
-
90
-
91
-
92
-
93
-
94
-
95
-
96
-
97
-
98
-
99
-
100
-
101
-
102
-
103
-
104
-
105
-
106
-
107
-
108
-
109
-
110
-
111
-
112
-
113
-
114
-
115
-
116
-
117
-
118
-
119
-
120
-
121
-
122
-
123
-
124
-
125
-
126
-
127
-
128
-
129
-
130
-
131
-
132
-
133
-
134
-
135
-
136
-
137
-
138
-
139
-
140
-
141
-
142
-
143
-
144
-
145
-
146
-
147
-
148
-
149
-
150
-
151
-
152
-
153
-
154
-
155
-
156
-
157
-
158
-
159
-
160
-
161
-
162
-
163
-
164
-
165
-
166
-
167
-
168
-
169
-
170
-
171
-
172
-
173
-
174
-
175
-
176
-
177
-
178
-
179
-
180
-
181
-
182
-
183
-
184
-
185
-
186
-
187
-
188
-
189
-
190
-
191
-
192
-
193
-
194
-
195
-
196
-
197
-
198
-
199
-
200
-
201
-
202
-
203
-
204
-
205
-
206
-
207
-
208
-
209
-
210
-
211
-
212
-
213
-
214
-
215
-
216
-
217
-
218
-
219
-
220
-
221
-
222
-
223
-
224
-
225
-
226
-
227
-
228
-
229
-
230
-
231
-
232
-
233
-
234
-
235
-
236
-
237
-
238
-
239
-
240
-
241
-
242
-
243
-
244
-
245
-
246
-
247
-
248
-
249
-
250
-
251
-
252
-
253
-
254
-
255
-
256
-
257
-
258
-
259
-
260
-
261
-
262
-
263
-
264
-
265
-
266
-
267
-
268
-
269
-
270
-
271
-
272
-
273
-
274
-
275
-
276
-
277
-
278
-
279
-
 280
280 -
 281
281 -
 282
282 -
 283
283 -
 284
284 -
 285
285 -
 286
286 -
 287
287 -
 288
288 -
 289
289 -
 290
290 -
 291
291 -
 292
292 -
 293
293 -
 294
294 -
 295
295 -
 296
296 -
 297
297 -
 298
298 -
 299
299
 |
 |

289RBS Group Annual Report and Accounts 2008
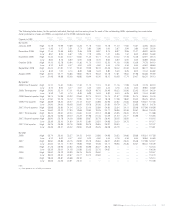
The following table shows, for the periods indicated, the high and low sales prices for each of the outstanding ADSs representing non-cumulative
dollar preference shares and PROs, as reported on the NYSE composite tape:
Series F Series H Series L Series M Series N Series P Series Q Series R Series S Series T Series U
Figures in US$ ADSs ADSs ADSs ADSs ADSs ADSs ADSs ADSs ADSs ADSs ADSs PROs(1)
By month
January 2009 High 14.19 12.99 10.89 12.25 11.75 11.50 12.18 11.30 11.84 13.51 43.96 56.03
Low 3.35 3.17 2.51 2.73 2.80 2.68 3.00 2.67 2.94 3.80 12.49 25.00
December 2008 High 11.33 10.55 8.80 9.45 9.29 8.97 9.74 8.97 9.55 11.07 48.92 56.25
Low 8.51 8.03 6.67 7.05 7.19 6.95 7.47 6.96 7.32 8.42 39.84 53.60
November 2008 High 13.34 13.40 10.37 10.84 11.30 10.71 11.34 10.32 11.15 12.36 52.91 69.74
Low 8.60 6.75 5.50 6.00 6.48 5.70 5.64 5.50 6.00 6.40 46.89 55.25
October 2008 High 14.10 12.78 10.94 11.36 11.70 11.10 12.20 11.16 11.98 13.09 74.78 84.10
Low 5.10 5.00 4.37 4.51 4.20 4.50 4.34 4.16 4.36 5.43 44.62 68.63
September 2008 High 23.24 21.90 17.31 19.36 19.29 18.76 20.49 18.32 20.06 22.42 86.72 96.30
Low 8.39 7.00 4.74 8.49 5.98 5.24 5.80 5.40 6.25 8.00 74.34 83.82
August 2008 High 24.00 22.11 16.86 18.83 18.72 18.22 20.18 17.81 19.53 21.98 84.68 90.90
Low 21.45 19.88 15.06 16.85 16.44 16.30 18.12 16.05 17.74 20.07 83.20 90.13
By quarter
2008: Fourth quarter High 14.10 13.40 10.94 11.36 11.70 11.10 12.20 11.16 11.98 13.09 74.78 84.10
Low 5.10 5.00 4.37 4.51 4.20 4.50 4.34 4.16 4.36 5.43 39.84 53.60
2008: Third quarter High 24.00 22.11 17.31 19.36 19.29 18.76 20.49 18.32 20.06 22.42 92.03 96.30
Low 8.39 7.00 4.74 8.49 5.98 5.24 5.80 5.40 6.25 8.00 74.34 83.82
2008: Second quarter High 25.74 24.95 20.22 22.64 22.73 22.01 23.74 21.57 22.99 24.73 96.63 93.76
Low 21.50 20.15 16.12 17.90 18.10 17.34 18.78 17.08 18.62 20.40 85.25 89.23
2008: First quarter High 25.59 25.30 22.27 24.12 24.01 23.85 24.95 23.52 24.66 25.66 105.61 107.55
Low 24.50 24.00 18.05 20.60 19.78 20.05 21.80 19.79 20.77 23.95 86.13 93.76
2007: Fourth quarter High 25.85 25.50 21.34 23.23 23.10 22.89 24.80 22.54 24.11 25.48 107.98 109.95
Low 23.60 22.70 17.90 19.68 19.50 19.25 20.71 18.96 20.26 22.61 98.34 100.49
2007: Third quarter High 26.23 25.60 22.23 24.60 24.30 24.14 25.88 23.55 25.20 25.10 — 112.88
Low 25.25 24.95 20.30 22.22 21.98 21.76 23.49 21.20 22.77 24.95 — 104.94
2007: Second quarter High 26.50 25.78 24.36 25.88 25.67 25.78 26.40 25.35 25.00 ——118.15
Low 25.39 25.10 21.80 24.10 23.81 23.51 24.95 23.30 24.75 ——110.17
2007: First quarter High 25.76 25.85 24.75 25.99 25.75 25.83 26.91 25.50 ———122.07
Low 25.26 25.21 24.02 25.50 25.35 25.25 26.08 24.79 ———115.81
By year
2008 High 25.74 25.30 22.27 24.12 24.01 23.85 24.95 23.52 24.66 25.66 105.61 107.55
Low 5.10 5.00 4.37 4.51 4.20 4.50 4.34 4.16 4.36 5.43 39.84 53.60
2007 High 26.50 25.85 24.75 25.99 25.75 25.83 26.91 25.50 25.20 25.48 107.98 122.07
Low 23.60 22.70 17.90 19.68 19.50 19.25 20.71 18.96 20.26 22.61 98.34 100.49
2006 High 27.25 25.95 24.62 26.08 25.96 26.07 26.76 ————122.23
Low 25.29 25.01 21.15 23.58 23.32 22.76 24.67 ————106.06
2005 High 28.00 26.19 24.99 26.75 26.23 25.50 —————129.57
Low 26.02 25.20 22.67 24.77 24.70 24.60 —————116.70
2004 High 28.45 25.87 24.68 26.16 ———————125.14
Low 25.65 24.45 23.51 25.13 ———————110.58
Note:
(1) Price quoted as a % of US$1,000 nominal.