RBS 2008 Annual Report Download - page 52
Download and view the complete annual report
Please find page 52 of the 2008 RBS annual report below. You can navigate through the pages in the report by either clicking on the pages listed below, or by using the keyword search tool below to find specific information within the annual report.-
 1
1 -
2
-
3
-
4
-
5
-
6
-
7
-
8
-
9
-
10
-
11
-
12
-
13
-
14
-
15
-
16
-
17
-
18
-
19
-
20
-
21
-
22
-
23
-
24
-
25
-
26
-
27
-
28
-
29
-
30
-
31
-
32
-
33
-
34
-
35
-
36
-
37
-
38
-
39
-
40
-
41
-
 42
42 -
 43
43 -
 44
44 -
 45
45 -
 46
46 -
 47
47 -
 48
48 -
 49
49 -
 50
50 -
 51
51 -
 52
52 -
 53
53 -
 54
54 -
 55
55 -
 56
56 -
 57
57 -
 58
58 -
 59
59 -
 60
60 -
 61
61 -
 62
62 -
63
-
64
-
65
-
66
-
67
-
68
-
69
-
70
-
71
-
72
-
73
-
74
-
75
-
76
-
77
-
78
-
79
-
80
-
81
-
82
-
83
-
84
-
85
-
86
-
87
-
88
-
89
-
90
-
91
-
92
-
93
-
94
-
95
-
96
-
97
-
98
-
99
-
100
-
101
-
102
-
103
-
104
-
105
-
106
-
107
-
108
-
109
-
110
-
111
-
112
-
113
-
114
-
115
-
116
-
117
-
118
-
119
-
120
-
121
-
122
-
123
-
124
-
125
-
126
-
127
-
128
-
129
-
130
-
131
-
132
-
133
-
134
-
135
-
136
-
137
-
138
-
139
-
140
-
141
-
142
-
143
-
144
-
145
-
146
-
147
-
148
-
149
-
150
-
151
-
152
-
153
-
154
-
155
-
156
-
157
-
158
-
159
-
160
-
161
-
162
-
163
-
164
-
165
-
166
-
167
-
168
-
169
-
170
-
171
-
172
-
173
-
174
-
175
-
176
-
177
-
178
-
179
-
180
-
181
-
182
-
183
-
184
-
185
-
186
-
187
-
188
-
189
-
190
-
191
-
192
-
193
-
194
-
195
-
196
-
197
-
198
-
199
-
200
-
201
-
202
-
203
-
204
-
205
-
206
-
207
-
208
-
209
-
210
-
211
-
212
-
213
-
214
-
215
-
216
-
217
-
218
-
219
-
220
-
221
-
222
-
223
-
224
-
225
-
226
-
227
-
228
-
229
-
230
-
231
-
232
-
233
-
234
-
235
-
236
-
237
-
238
-
239
-
240
-
241
-
242
-
243
-
244
-
245
-
246
-
247
-
248
-
249
-
250
-
251
-
252
-
253
-
254
-
255
-
256
-
257
-
258
-
259
-
260
-
261
-
262
-
263
-
264
-
265
-
266
-
267
-
268
-
269
-
270
-
271
-
272
-
273
-
274
-
275
-
276
-
277
-
278
-
279
-
280
-
281
-
282
-
283
-
284
-
285
-
286
-
287
-
288
-
289
-
290
-
291
-
292
-
293
-
294
-
295
-
296
-
297
-
298
-
299
 |
 |

51RBS Group Annual Report and Accounts 2008
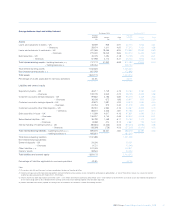
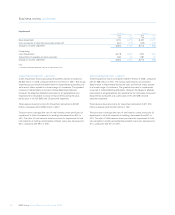
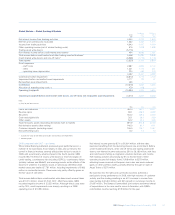
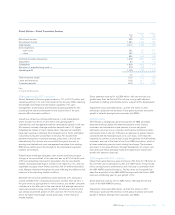
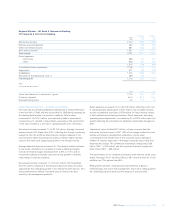
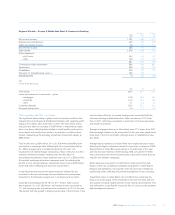
Global Markets – Global Banking & Markets
Pro forma Statutory
2008 2007 2007
£m £m £m
Net interest income from banking activities 4,034 2,214 1,544
Net fees and commissions receivable 1,562 2,351 1,373
Income from trading activities 4,043 4,407 4,019
Other operating income (net of related funding costs) 575 1,908 1,659
Trading asset write-downs (5,776) ——
Non-interest income before credit market write-downs* 404 8,666 7,051
Total income before credit market and other trading asset write-downs* 4,438 10,880 8,595
Credit market write-downs and one-off items* (6,958) (1,776) (1,776)
Total income (2,520) 9,104 6,819
Direct expenses
– staff costs 2,687 3,853 2,134
– other 1,441 1,113 561
– operating lease depreciation 224 365 404
4,352 5,331 3,099
Contribution before impairment (6,872) 3,773 3,720
Impairment before reclassified asset impairments 3,177 122 67
Reclassified asset impairments 466 ——
Contribution (10,515) 3,651 3,653
Allocation of manufacturing costs (1) 479 448 —
Operating (loss)/profit (10,994) 3,203 3,653
Operating (loss)/profit before credit market write-downs, one-off items and reclassified asset impairments (3,570) 4,641 5,052
Note:
(1) Only for pro forma results.
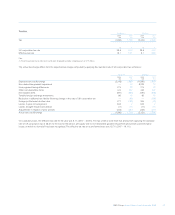
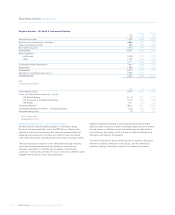
£bn £bn £bn
Loans and advances 354.3 254.1 254.1
Reverse repos 96.1 308.9 308.9
Securities 163.2 239.5 239.5
Cash and eligible bills 26.1 26.9 26.9
Other assets 52.2 44.4 44.5
Total third party assets (excluding derivatives mark to market) 691.9 873.8 873.9
Net derivative assets (after netting) 146.0 64.1 64.1
Customer deposits (excluding repos) 105.0 106.7 106.7
Non-performing loans 6.2 1.0 1.0
* includes fair value of own debt but excludes reclassified asset impairments.
** excluding repos
2008 compared with 2007 – pro forma
While Global Banking & Markets produced good performances in a
number of its businesses, most notably in rates and currencies, the
turmoil in financial markets severely affected the division’s results in
2008, with a particularly adverse impact in the fourth quarter. GBM
incurred £5,776 million of losses, write-downs or reserves largely on
credit trading, counterparty risk (including CDPCs), counterparty failure
(notably Lehman and Madoff) and sovereign events as the effects of the
down-turn widened. In addition, losses on previously identified credit
market exposures totalled £7,781 million, including impairments of £466
million on reclassified assets. These were only partly offset by gains on
the fair value of own debt.
Total income before these credit market write-downs and unusual items
was £10,214 million, down 6% from 2007. After these items, GBM
recorded negative income of £2,520 million. Although direct costs were
cut by 18%, credit impairments rose sharply, resulting in a 2008
operating loss of £10,994 million.
Net interest income grew by 82% to £4,034 million, with the rates
business benefiting from the declining interest rate environment. Before
credit market write-downs, other one-off items and trading asset write-
downs, non-interest income reduced by 29% to £6,180 million, with fees
and commissions falling as origination volumes declined, and income
from trading activities decreasing by 8% to £4,043 million. Other
operating income fell sharply from £1,908 million to £575 million,
reflecting losses incurred on European loan sales and much reduced
gains on other portfolio assets, partially offset by the gain on sale of
Angel Trains of £570 million.
By business line, the rates and currencies business achieved a
particularly strong performance in 2008, with high volumes of customer
activity and flow trading resulting in an 40% increase in income from
rates trading to £3,543 million and 55% growth in currencies income to
£1,697 million. The Sempra Commodities joint venture performed ahead
of expectations in the nine months since its formation, with GBM’s
commodities income reaching £778 million for the year.