RBS 2008 Annual Report Download - page 273
Download and view the complete annual report
Please find page 273 of the 2008 RBS annual report below. You can navigate through the pages in the report by either clicking on the pages listed below, or by using the keyword search tool below to find specific information within the annual report.-
 1
1 -
2
-
3
-
4
-
5
-
6
-
7
-
8
-
9
-
10
-
11
-
12
-
13
-
14
-
15
-
16
-
17
-
18
-
19
-
20
-
21
-
22
-
23
-
24
-
25
-
26
-
27
-
28
-
29
-
30
-
31
-
32
-
33
-
34
-
35
-
36
-
37
-
38
-
39
-
40
-
41
-
42
-
43
-
44
-
45
-
46
-
47
-
48
-
49
-
50
-
51
-
52
-
53
-
54
-
55
-
56
-
57
-
58
-
59
-
60
-
61
-
62
-
63
-
64
-
65
-
66
-
67
-
68
-
69
-
70
-
71
-
72
-
73
-
74
-
75
-
76
-
77
-
78
-
79
-
80
-
81
-
82
-
83
-
84
-
85
-
86
-
87
-
88
-
89
-
90
-
91
-
92
-
93
-
94
-
95
-
96
-
97
-
98
-
99
-
100
-
101
-
102
-
103
-
104
-
105
-
106
-
107
-
108
-
109
-
110
-
111
-
112
-
113
-
114
-
115
-
116
-
117
-
118
-
119
-
120
-
121
-
122
-
123
-
124
-
125
-
126
-
127
-
128
-
129
-
130
-
131
-
132
-
133
-
134
-
135
-
136
-
137
-
138
-
139
-
140
-
141
-
142
-
143
-
144
-
145
-
146
-
147
-
148
-
149
-
150
-
151
-
152
-
153
-
154
-
155
-
156
-
157
-
158
-
159
-
160
-
161
-
162
-
163
-
164
-
165
-
166
-
167
-
168
-
169
-
170
-
171
-
172
-
173
-
174
-
175
-
176
-
177
-
178
-
179
-
180
-
181
-
182
-
183
-
184
-
185
-
186
-
187
-
188
-
189
-
190
-
191
-
192
-
193
-
194
-
195
-
196
-
197
-
198
-
199
-
200
-
201
-
202
-
203
-
204
-
205
-
206
-
207
-
208
-
209
-
210
-
211
-
212
-
213
-
214
-
215
-
216
-
217
-
218
-
219
-
220
-
221
-
222
-
223
-
224
-
225
-
226
-
227
-
228
-
229
-
230
-
231
-
232
-
233
-
234
-
235
-
236
-
237
-
238
-
239
-
240
-
241
-
242
-
243
-
244
-
245
-
246
-
247
-
248
-
249
-
250
-
251
-
252
-
253
-
254
-
255
-
256
-
257
-
258
-
259
-
260
-
261
-
262
-
 263
263 -
 264
264 -
 265
265 -
 266
266 -
 267
267 -
 268
268 -
 269
269 -
 270
270 -
 271
271 -
 272
272 -
 273
273 -
 274
274 -
 275
275 -
 276
276 -
 277
277 -
 278
278 -
 279
279 -
 280
280 -
 281
281 -
 282
282 -
 283
283 -
284
-
285
-
286
-
287
-
288
-
289
-
290
-
291
-
292
-
293
-
294
-
295
-
296
-
297
-
298
-
299
 |
 |

RBS Group Annual Report and Accounts 2008272
Additional information continued
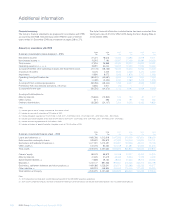
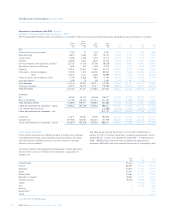
Amounts in accordance with IFRS (continued)
Loan impairment provisions (continued)
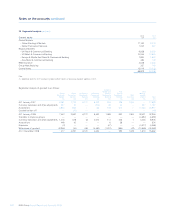
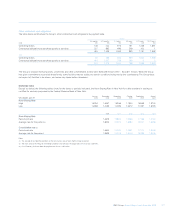
The following table shows additional information in respect of the loan impairment provisions.
IFRS
2008 2007 2006 2005 2004
£m £m £m £m £m
Loan impairment provisions at end of year:
– customers 10,889 6,449 3,933 3,884
– banks 127 323
Specific provisions
– customers 3,607
– banks 6
General provision 561
11,016 6,452 3,935 3,887 4,174
Average loans and advances to customers (gross) 858,333 567,900 445,766 402,473 299,430
As a % of average loans and advances to customers during the year:
Total customer provisions charged to income statement 0.81% 0.34% 0.42% 0.42% 0.47%
Amounts written-off (net of recoveries) – customers 0.33% 0.29% 0.36% 0.46% 0.44%
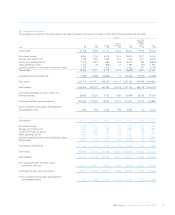
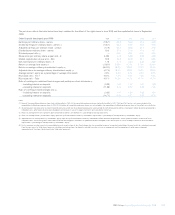
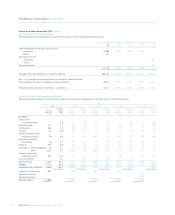
Analysis of closing loan impairment provisions
The following table analyses customer loan impairment provisions by geographical area and type of domestic customer.
IFRS
2008 2007 2006 2005 2004
% of loans % of loans % of loans % of loans % of loans
Closing to total Closing to total Closing to total Closing to total Closing to total
provision loans provision loans provision loans provision loans provision loans
£m % £m % £m % £m % £m %
Domestic
Central and
local government — 0.3 — 0.4 — 1.4 — 0.8 — 0.6
Manufacturing 127 1.7 93 1.6 94 2.4 138 2.8 127 1.8
Construction 254 1.1 75 1.2 63 1.8 74 1.7 71 1.4
Finance 67 4.8 52 8.4 33 5.3 104 6.4 54 7.0
Service industries and
business activities 778 6.6 562 6.5 647 9.3 647 9.7 516 8.8
Agriculture, forestry
and fishing 19 0.3 21 0.3 25 0.6 26 0.6 23 0.7
Property 490 5.9 85 6.0 70 8.3 63 7.8 64 7.5
Individuals – home mortgages 36 9.1 36 8.8 37 15.1 36 15.5 32 16.4
– other 2,235 3.0 2,054 3.4 1,826 5.9 1,513 6.3 1,277 7.5
Finance leases and
instalment credit 194 2.0 132 1.9 103 3.0 88 3.3 122 3.7
Accrued interest — 0.3 — 0.3 — 0.3 — 0.3
Total domestic 4,200 35.1 3,110 38.8 2,898 53.4 2,689 55.2 2,286 55.4
Foreign 4,745 64.9 2,289 61.2 442 46.6 652 44.8 1,321 44.6
Impaired book provisions 8,945 100.0 5,399 100.0 3,340 100.0 3,341 100.0 100.0
Latent book provisions 1,944 1,050 593 543
Specific provisions 3,607
General provision 561
Total provisions 10,889 6,449 3,933 3,884 4,168