RBS 2008 Annual Report Download - page 234
Download and view the complete annual report
Please find page 234 of the 2008 RBS annual report below. You can navigate through the pages in the report by either clicking on the pages listed below, or by using the keyword search tool below to find specific information within the annual report.-
 1
1 -
2
-
3
-
4
-
5
-
6
-
7
-
8
-
9
-
10
-
11
-
12
-
13
-
14
-
15
-
16
-
17
-
18
-
19
-
20
-
21
-
22
-
23
-
24
-
25
-
26
-
27
-
28
-
29
-
30
-
31
-
32
-
33
-
34
-
35
-
36
-
37
-
38
-
39
-
40
-
41
-
42
-
43
-
44
-
45
-
46
-
47
-
48
-
49
-
50
-
51
-
52
-
53
-
54
-
55
-
56
-
57
-
58
-
59
-
60
-
61
-
62
-
63
-
64
-
65
-
66
-
67
-
68
-
69
-
70
-
71
-
72
-
73
-
74
-
75
-
76
-
77
-
78
-
79
-
80
-
81
-
82
-
83
-
84
-
85
-
86
-
87
-
88
-
89
-
90
-
91
-
92
-
93
-
94
-
95
-
96
-
97
-
98
-
99
-
100
-
101
-
102
-
103
-
104
-
105
-
106
-
107
-
108
-
109
-
110
-
111
-
112
-
113
-
114
-
115
-
116
-
117
-
118
-
119
-
120
-
121
-
122
-
123
-
124
-
125
-
126
-
127
-
128
-
129
-
130
-
131
-
132
-
133
-
134
-
135
-
136
-
137
-
138
-
139
-
140
-
141
-
142
-
143
-
144
-
145
-
146
-
147
-
148
-
149
-
150
-
151
-
152
-
153
-
154
-
155
-
156
-
157
-
158
-
159
-
160
-
161
-
162
-
163
-
164
-
165
-
166
-
167
-
168
-
169
-
170
-
171
-
172
-
173
-
174
-
175
-
176
-
177
-
178
-
179
-
180
-
181
-
182
-
183
-
184
-
185
-
186
-
187
-
188
-
189
-
190
-
191
-
192
-
193
-
194
-
195
-
196
-
197
-
198
-
199
-
200
-
201
-
202
-
203
-
204
-
205
-
206
-
207
-
208
-
209
-
210
-
211
-
212
-
213
-
214
-
215
-
216
-
217
-
218
-
219
-
220
-
221
-
222
-
223
-
 224
224 -
 225
225 -
 226
226 -
 227
227 -
 228
228 -
 229
229 -
 230
230 -
 231
231 -
 232
232 -
 233
233 -
 234
234 -
 235
235 -
 236
236 -
 237
237 -
 238
238 -
 239
239 -
 240
240 -
 241
241 -
 242
242 -
 243
243 -
 244
244 -
245
-
246
-
247
-
248
-
249
-
250
-
251
-
252
-
253
-
254
-
255
-
256
-
257
-
258
-
259
-
260
-
261
-
262
-
263
-
264
-
265
-
266
-
267
-
268
-
269
-
270
-
271
-
272
-
273
-
274
-
275
-
276
-
277
-
278
-
279
-
280
-
281
-
282
-
283
-
284
-
285
-
286
-
287
-
288
-
289
-
290
-
291
-
292
-
293
-
294
-
295
-
296
-
297
-
298
-
299
 |
 |

233RBS Group Annual Report and Accounts 2008
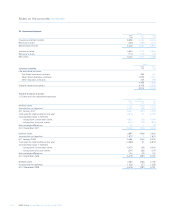
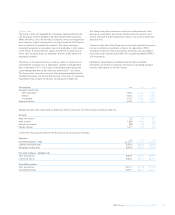
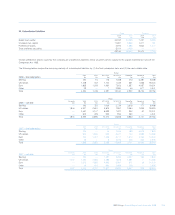
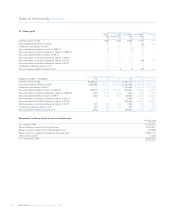
Assumptions 2008 2007 2006
Valuation interest rate
Term assurance 2.50% 3.00% 3.00%
Interest 2.50% 3.00% 3.00%
Unit growth 3.70% 3.50% 3.50%
Expense inflation 3.00% 4.00% 4.00%
Sample mortality rates, expressed as deaths per million per annum, for term assurance products (age 40).
Mortality
Male non-smoker 723 810 517
Male smoker 1,590 1,830 983
Female non-smoker 568 460 278
Female smoker 1,277 1,310 618
In 2007 the Group moved from the UK 80 series to the 00 series for mortality.
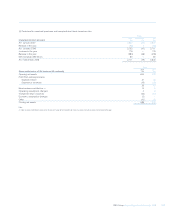
Expenses:
2008 2007 2006
Pre-2000 products – RSA per annum per annum per annum
Lifestyle protection plan £29.30 £25.18 £28.96
Mortgage savings plan £65.92 £56.67 £65.15
Pre-2000 products – NatWest Life
Term assurances £26.01 £26.01 £26.01
Linked life bonds £26.01 £23.17 £23.17
Post-2000 products
Term assurances £23.17 £23.16 £23.16
Guaranteed bonds £25.71 £25.71 £25.71
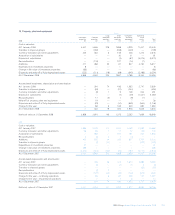
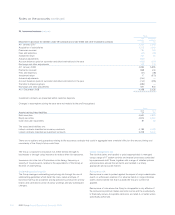
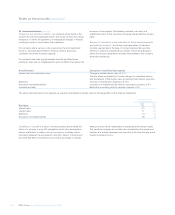
Life business
The Group’s three UK regulated life companies, National Westminster
Life Assurance Limited (NatWest Life), Royal Scottish Assurance plc
(RSA) and Direct Line Life Insurance Company Limited, are required to
meet minimum capital requirements at all times under the UK Financial
Service Authority’s Prudential Sourcebook. The capital resources
covering the regulatory requirement are not transferable to other areas
of the Group. To ensure that the capital requirement is satisfied at all
times, each company holds an additional voluntary buffer above the
regulatory minimum.
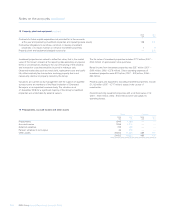
The Group is not exposed to price, currency, credit, or interest risk on
unit linked life contracts but it is exposed to variation in management
fees. A decrease of 10% in the value of the assets would reduce the
asset management fees by £5 million per annum (2007 – £2 million).
The Group writes insurance contracts with minimum guaranteed death
benefits that expose it to the risk that declines in the value of underlying
investments may increase the Group’s net exposure to death risk.
The Group’s long-term assurance contracts include whole-life, term
assurance, endowment assurances, flexible whole life, pension and
annuity contracts that are expected to remain in force for an extended
period of time.
Contracts under which the Group does not accept significant insurance
risk are classified as investment contracts. As required by IFRS 4
‘Insurance Contracts’ long term business provisions are calculated in
accordance with existing local GAAP (UK accounting standard FRS 27
‘Life Assurance’).
Estimations (assumptions) including future mortality, morbidity,
persistency and levels of expenses are made in calculating actuarial
reserves. Key metrics for the UK include: