RBS 2008 Annual Report Download - page 139
Download and view the complete annual report
Please find page 139 of the 2008 RBS annual report below. You can navigate through the pages in the report by either clicking on the pages listed below, or by using the keyword search tool below to find specific information within the annual report.-
 1
1 -
2
-
3
-
4
-
5
-
6
-
7
-
8
-
9
-
10
-
11
-
12
-
13
-
14
-
15
-
16
-
17
-
18
-
19
-
20
-
21
-
22
-
23
-
24
-
25
-
26
-
27
-
28
-
29
-
30
-
31
-
32
-
33
-
34
-
35
-
36
-
37
-
38
-
39
-
40
-
41
-
42
-
43
-
44
-
45
-
46
-
47
-
48
-
49
-
50
-
51
-
52
-
53
-
54
-
55
-
56
-
57
-
58
-
59
-
60
-
61
-
62
-
63
-
64
-
65
-
66
-
67
-
68
-
69
-
70
-
71
-
72
-
73
-
74
-
75
-
76
-
77
-
78
-
79
-
80
-
81
-
82
-
83
-
84
-
85
-
86
-
87
-
88
-
89
-
90
-
91
-
92
-
93
-
94
-
95
-
96
-
97
-
98
-
99
-
100
-
101
-
102
-
103
-
104
-
105
-
106
-
107
-
108
-
109
-
110
-
111
-
112
-
113
-
114
-
115
-
116
-
117
-
118
-
119
-
120
-
121
-
122
-
123
-
124
-
125
-
126
-
127
-
128
-
 129
129 -
 130
130 -
 131
131 -
 132
132 -
 133
133 -
 134
134 -
 135
135 -
 136
136 -
 137
137 -
 138
138 -
 139
139 -
 140
140 -
 141
141 -
 142
142 -
 143
143 -
 144
144 -
 145
145 -
 146
146 -
 147
147 -
 148
148 -
 149
149 -
150
-
151
-
152
-
153
-
154
-
155
-
156
-
157
-
158
-
159
-
160
-
161
-
162
-
163
-
164
-
165
-
166
-
167
-
168
-
169
-
170
-
171
-
172
-
173
-
174
-
175
-
176
-
177
-
178
-
179
-
180
-
181
-
182
-
183
-
184
-
185
-
186
-
187
-
188
-
189
-
190
-
191
-
192
-
193
-
194
-
195
-
196
-
197
-
198
-
199
-
200
-
201
-
202
-
203
-
204
-
205
-
206
-
207
-
208
-
209
-
210
-
211
-
212
-
213
-
214
-
215
-
216
-
217
-
218
-
219
-
220
-
221
-
222
-
223
-
224
-
225
-
226
-
227
-
228
-
229
-
230
-
231
-
232
-
233
-
234
-
235
-
236
-
237
-
238
-
239
-
240
-
241
-
242
-
243
-
244
-
245
-
246
-
247
-
248
-
249
-
250
-
251
-
252
-
253
-
254
-
255
-
256
-
257
-
258
-
259
-
260
-
261
-
262
-
263
-
264
-
265
-
266
-
267
-
268
-
269
-
270
-
271
-
272
-
273
-
274
-
275
-
276
-
277
-
278
-
279
-
280
-
281
-
282
-
283
-
284
-
285
-
286
-
287
-
288
-
289
-
290
-
291
-
292
-
293
-
294
-
295
-
296
-
297
-
298
-
299
 |
 |

Business review continued
RBS Group Annual Report and Accounts 2008138
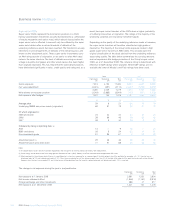
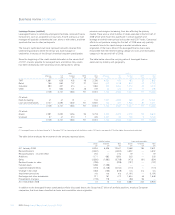
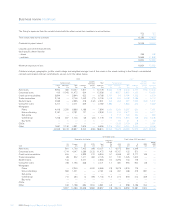
2008 2007 (1)
Americas UK Europe ROW Total Americas UK Europe ROW Total
£m £m £m £m £m £m £m £m £m £m
TMT 1,681 628 402 45 2,756 6,924 424 482 25 7,855
Retail 166 550 707 21 1,444 542 1,318 800 49 2,709
Industrial 280 391 413 — 1,084 249 2,003 1,074 44 3,370
Other 11 552 141 35 739 25 339 271 13 648
2,138 2,121 1,663 101 6,023 7,740 4,084 2,627 131 14,582
Of which:
Held-for-trading 31 31 41 — 103 7,607 3,694 689 51 12,041
Loan and receivables 2,107 2,090 1,622 101 5,920 133 390 1,938 80 2,541
2,138 2,121 1,663 101 6,023 7,740 4,084 2,627 131 14,582
Of which:
Drawn 2,081 2,090 1,453 94 5,718 2,249 4,025 2,478 122 8,874
Undrawn 57 31 210 7 305 5,491 59 149 9 5,708
2,138 2,121 1,663 101 6,023 7,740 4,084 2,627 131 14,582
Note:
(1) Leveraged finance as disclosed above for 31 December 2007 has been aligned with definitions used in 2008 and is consequently £76 million higher than previously published.
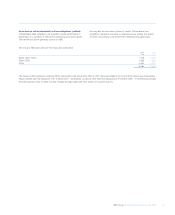
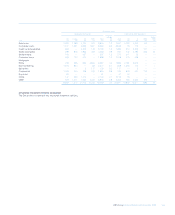
The table below analyses the movement in the amounts reported above.
Held-for-trading Loans and receivables
Drawn Undrawn Total Drawn Undrawn Total
£m £m £m £m £m £m
At 1 January 2008 6,516 5,525 12,041 2,358 183 2,541
Reclassifications (3,602) — (3,602) 3,602 — 3,602
Reclassifications – income effect 216 — 216 19 — 19
Additions 1,171 682 1,853 235 — 235
Sales (3,826) (1,882) (5,708) (473) (81) (554)
Realised losses on sales (298) — (298) (197) — (197)
Funded deals 1,298 (1,298) ————
Lapsed/collapsed deals (415) (3,738) (4,153) (173) — (173)
Change in fair value (462) (156) (618) n/a n/a n/a
Impairment provisions n/a n/a n/a (1,191) — (1,191)
Exchange and other movements 211 161 372 1,603 35 1,638
Presentation changes (778) 778 — (96) 96 —
At 31 December 2008 31 72 103 5,687 233 5,920
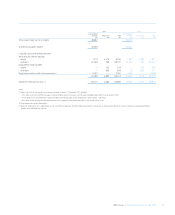
In addition to the leveraged finance syndicated portfolio discussed above, the Group has £7 billion of portfolio positions, mostly to European
companies, that have been classified as loans and receivables since origination.
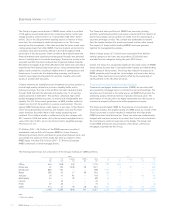
Leverage finance (audited)
Leveraged finance is commonly employed to facilitate corporate finance
transactions, such as acquisitions or buy-outs. A bank acting as a lead
manager will typically underwrite the loan, alone or with others, and then
syndicate the loan to other participants.
The Group’s syndicated loan book represent amounts retained from
underwriting positions where the Group was lead manager or
underwriter, in excess of the Group’s intended long term participation.
Since the beginning of the credit market dislocation in the second half
of 2007, investor appetite for leveraged loans and similar risky assets
has fallen dramatically, with secondary prices falling due to selling
pressure and margins increasing, thus also affecting the primary
market. There were a small number of deals executed in the first half of
2008 which were much less significant in overall quantum and
leverage and which were priced at less than mid-2007 levels. Concerted
efforts to sell positions during the first half of 2008 were only partially
successful due to the rapid change in market conditions since
origination of the loans. Most of the leveraged finance loans were
reclassified from the held-for-trading category to loans and receivables
category in the second half of 2008.
The table below shows the carrying value of leveraged finance
exposures by industry and geography.