RBS 2008 Annual Report Download - page 115
Download and view the complete annual report
Please find page 115 of the 2008 RBS annual report below. You can navigate through the pages in the report by either clicking on the pages listed below, or by using the keyword search tool below to find specific information within the annual report.-
 1
1 -
2
-
3
-
4
-
5
-
6
-
7
-
8
-
9
-
10
-
11
-
12
-
13
-
14
-
15
-
16
-
17
-
18
-
19
-
20
-
21
-
22
-
23
-
24
-
25
-
26
-
27
-
28
-
29
-
30
-
31
-
32
-
33
-
34
-
35
-
36
-
37
-
38
-
39
-
40
-
41
-
42
-
43
-
44
-
45
-
46
-
47
-
48
-
49
-
50
-
51
-
52
-
53
-
54
-
55
-
56
-
57
-
58
-
59
-
60
-
61
-
62
-
63
-
64
-
65
-
66
-
67
-
68
-
69
-
70
-
71
-
72
-
73
-
74
-
75
-
76
-
77
-
78
-
79
-
80
-
81
-
82
-
83
-
84
-
85
-
86
-
87
-
88
-
89
-
90
-
91
-
92
-
93
-
94
-
95
-
96
-
97
-
98
-
99
-
100
-
101
-
102
-
103
-
104
-
 105
105 -
 106
106 -
 107
107 -
 108
108 -
 109
109 -
 110
110 -
 111
111 -
 112
112 -
 113
113 -
 114
114 -
 115
115 -
 116
116 -
 117
117 -
 118
118 -
 119
119 -
 120
120 -
 121
121 -
 122
122 -
 123
123 -
 124
124 -
 125
125 -
126
-
127
-
128
-
129
-
130
-
131
-
132
-
133
-
134
-
135
-
136
-
137
-
138
-
139
-
140
-
141
-
142
-
143
-
144
-
145
-
146
-
147
-
148
-
149
-
150
-
151
-
152
-
153
-
154
-
155
-
156
-
157
-
158
-
159
-
160
-
161
-
162
-
163
-
164
-
165
-
166
-
167
-
168
-
169
-
170
-
171
-
172
-
173
-
174
-
175
-
176
-
177
-
178
-
179
-
180
-
181
-
182
-
183
-
184
-
185
-
186
-
187
-
188
-
189
-
190
-
191
-
192
-
193
-
194
-
195
-
196
-
197
-
198
-
199
-
200
-
201
-
202
-
203
-
204
-
205
-
206
-
207
-
208
-
209
-
210
-
211
-
212
-
213
-
214
-
215
-
216
-
217
-
218
-
219
-
220
-
221
-
222
-
223
-
224
-
225
-
226
-
227
-
228
-
229
-
230
-
231
-
232
-
233
-
234
-
235
-
236
-
237
-
238
-
239
-
240
-
241
-
242
-
243
-
244
-
245
-
246
-
247
-
248
-
249
-
250
-
251
-
252
-
253
-
254
-
255
-
256
-
257
-
258
-
259
-
260
-
261
-
262
-
263
-
264
-
265
-
266
-
267
-
268
-
269
-
270
-
271
-
272
-
273
-
274
-
275
-
276
-
277
-
278
-
279
-
280
-
281
-
282
-
283
-
284
-
285
-
286
-
287
-
288
-
289
-
290
-
291
-
292
-
293
-
294
-
295
-
296
-
297
-
298
-
299
 |
 |

RBS Group Annual Report and Accounts 2008114
Business review continued
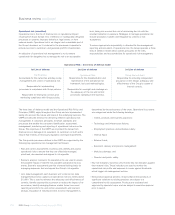
Currency risk (audited)
The Group does not maintain material non-trading open currency
positions other than the structural foreign currency translation exposures
arising from its investments in foreign subsidiaries and associated
undertakings and their related currency funding. The Group’s policy in
relation to structural positions is to match fund the structural foreign
currency exposure arising from net asset value, including goodwill, in
foreign subsidiaries, equity accounted investments and branches,
except where doing so would materially increase the sensitivity of either
the Group’s or the subsidiary’s regulatory capital ratios to currency
movements. The policy requires structural foreign exchange positions to
be reviewed regularly by GALCO. Foreign exchange differences arising
on the translation of foreign operations are recognised directly in equity
together with the effective portion of foreign exchange differences
arising on hedging instruments.
Equity classification of foreign currency denominated preference share
issuances requires that these shares be held on the balance sheet at
historic cost. Consequently, these share issuances have the effect of
increasing the Group’s structural foreign currency position.
Retranslation gains and losses on the Group’s net investments in
operations together with those on instruments hedging these
investments are recognised directly in equity. Changes in foreign
currency exchange rates will affect equity in proportion to the structural
foreign currency exposure. A five percent strengthening in foreign
currencies would result in a gain of £1,010 million (2007 – £1,200
million) recognised in equity, while a five per cent weakening in foreign
currencies would result in a loss of £960 million (2007 - £1,140 million)
recognised in equity. These movements in equity would
offset retranslation effects on the Group's foreign currency
denominated risk weighted assets, reducing the sensitivity of
the Group's Tier 1 capital ratio to movements in foreign currency
exchange rates.
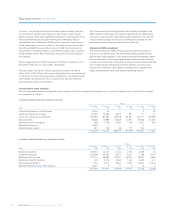
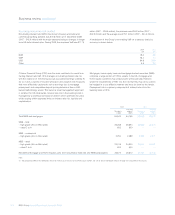
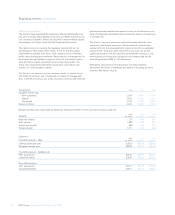
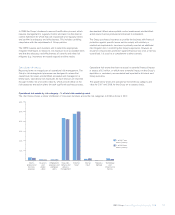
The tables below set out the Group’s structural foreign currency exposures:
Net Structural
Net assets investments Net foreign
of overseas Minority in foreign investment currency
operations interests operations hedges exposures
2008 £m £m £m £m £m
US dollar 17,480 (19) 17,499 (3,659) 13,840
Euro 26,943 15,431 11,512 (7,461) 4,051
Chinese RMB 3,928 1,898 2,030 (1,082) 948
Other non-sterling 5,088 621 4,467 (3,096) 1,371
53,439 17,931 35,508 (15,298) 20,210
2007
US dollar 14,819 303 14,516 (2,541) 11,975
Euro 46,629 28,647 17,982 (8,818) 9,164
Chinese RMB 2,600 — 2,600 (1,939) 661
Brazilian real 3,755 3,755 ———
Other non-sterling 3,905 519 3,386 (1,219) 2,167
71,708 33,224 38,484 (14,517) 23,967
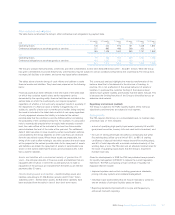
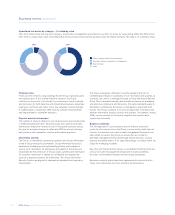
Equity risk (audited)
Equity positions are measured at fair value. Fair value calculations are
based on available market prices wherever possible. In the event that
market prices are not available, fair value is based on appropriate
valuation techniques or management estimates.
The types, nature and amounts of exchange-traded exposures, private
equity exposures, and other exposures vary significantly. Such exposures
may take the form of listed and unlisted equity shares, linked equity
fund investments, private equity and venture capital investments,
preference shares classified as equity and Federal Home Loan Stock.
The table below sets out the balance sheet value of equity exposures at
December 2008.
Listed Unlisted Total
Equity exposures* £m £m £m
Group before RFS Holdings minority interest 4,211 2,759 6,970
RFS Holdings minority interest 56 259 315
Group 4,267 3,018 7,285
* excludes equity exposures held-for-trading purposes and by insurance/assurance entities.