RBS 2008 Annual Report Download - page 45
Download and view the complete annual report
Please find page 45 of the 2008 RBS annual report below. You can navigate through the pages in the report by either clicking on the pages listed below, or by using the keyword search tool below to find specific information within the annual report.-
 1
1 -
2
-
3
-
4
-
5
-
6
-
7
-
8
-
9
-
10
-
11
-
12
-
13
-
14
-
15
-
16
-
17
-
18
-
19
-
20
-
21
-
22
-
23
-
24
-
25
-
26
-
27
-
28
-
29
-
30
-
31
-
32
-
33
-
34
-
 35
35 -
 36
36 -
 37
37 -
 38
38 -
 39
39 -
 40
40 -
 41
41 -
 42
42 -
 43
43 -
 44
44 -
 45
45 -
 46
46 -
 47
47 -
 48
48 -
 49
49 -
 50
50 -
 51
51 -
 52
52 -
 53
53 -
 54
54 -
 55
55 -
56
-
57
-
58
-
59
-
60
-
61
-
62
-
63
-
64
-
65
-
66
-
67
-
68
-
69
-
70
-
71
-
72
-
73
-
74
-
75
-
76
-
77
-
78
-
79
-
80
-
81
-
82
-
83
-
84
-
85
-
86
-
87
-
88
-
89
-
90
-
91
-
92
-
93
-
94
-
95
-
96
-
97
-
98
-
99
-
100
-
101
-
102
-
103
-
104
-
105
-
106
-
107
-
108
-
109
-
110
-
111
-
112
-
113
-
114
-
115
-
116
-
117
-
118
-
119
-
120
-
121
-
122
-
123
-
124
-
125
-
126
-
127
-
128
-
129
-
130
-
131
-
132
-
133
-
134
-
135
-
136
-
137
-
138
-
139
-
140
-
141
-
142
-
143
-
144
-
145
-
146
-
147
-
148
-
149
-
150
-
151
-
152
-
153
-
154
-
155
-
156
-
157
-
158
-
159
-
160
-
161
-
162
-
163
-
164
-
165
-
166
-
167
-
168
-
169
-
170
-
171
-
172
-
173
-
174
-
175
-
176
-
177
-
178
-
179
-
180
-
181
-
182
-
183
-
184
-
185
-
186
-
187
-
188
-
189
-
190
-
191
-
192
-
193
-
194
-
195
-
196
-
197
-
198
-
199
-
200
-
201
-
202
-
203
-
204
-
205
-
206
-
207
-
208
-
209
-
210
-
211
-
212
-
213
-
214
-
215
-
216
-
217
-
218
-
219
-
220
-
221
-
222
-
223
-
224
-
225
-
226
-
227
-
228
-
229
-
230
-
231
-
232
-
233
-
234
-
235
-
236
-
237
-
238
-
239
-
240
-
241
-
242
-
243
-
244
-
245
-
246
-
247
-
248
-
249
-
250
-
251
-
252
-
253
-
254
-
255
-
256
-
257
-
258
-
259
-
260
-
261
-
262
-
263
-
264
-
265
-
266
-
267
-
268
-
269
-
270
-
271
-
272
-
273
-
274
-
275
-
276
-
277
-
278
-
279
-
280
-
281
-
282
-
283
-
284
-
285
-
286
-
287
-
288
-
289
-
290
-
291
-
292
-
293
-
294
-
295
-
296
-
297
-
298
-
299
 |
 |

RBS Group Annual Report and Accounts 200844
Business review continued
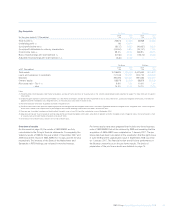
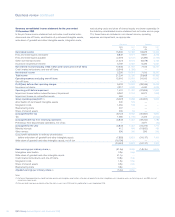
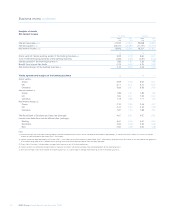
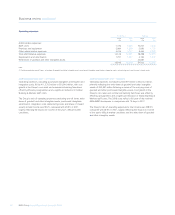
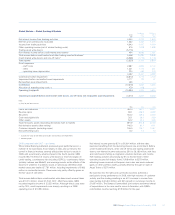
Non-interest income
Pro forma (1) Statutory
2008 2007 2008 2007
£m £m £m £m
Fees and commissions receivable 8,839 9,171 9,831 8,278
Fees and commissions payable (2,391) (2,147) (2,386) (2,193)
(Loss)/income from trading activities (1,647) 4,808 (8,477) 1,292
Other operating income (excluding insurance net premium income) 426 3,368 1,899 4,833
5,227 15,200 867 12,210
Insurance premium income 6,009 6,271 6,626 6,376
Reinsurers’ share (300) (289) (300) (289)
5,709 5,982 6,326 6,087
10,936 21,182 7,193 18,297
Note:
(1) Pro forma excludes credit market write-downs and one-off items.
2008 compared with 2007 – pro forma
Non-interest income, excluding credit market write-downs and one-off
items, decreased by 48%, £10,246 million to £10,936 million.
Non-interest income was severely affected by the weakness in financial
markets experienced over the course of the year. While the decline was
particularly marked in Global Banking & Market's credit markets and
equities businesses, with reduced business volumes and mounting
mark-to-market trading losses, Regional Markets also saw non-interest
income fall in the latter part of the year as declining consumer
confidence led to lower demand for credit and other financial products.
Excluding general insurance premium income, non-interest income fell
by £9,973 million to £5,227 million.
Within non-interest income, fees and commissions receivable decreased
by £332 million, 3%, to £8,839 million, while fees and commissions
payable increased by £244 million, 11%, to £2,391 million.
Income from trading activities was down £6,455 million to a loss of
£1,647 million. Currency trading activities benefitted from increased
volatility in the markets. However, this improvement was more than offset
by credit markets write downs and reduced interest rate income
impacted by the reduction of base interest rates.
Other operating income also decreased, falling by 87%, £2,942 million
to £426 million. This was principally due to a fall in the fair value of
securities and other financial assets and liabilities.
General insurance premium income, after reinsurance, decreased
by 5% to £5,709 million primarily reflecting a fall in insurance
premium income following the discontinuation of less profitable
partnership contracts.
2008 compared with 2007 – statutory
Non-interest income, decreased by 61%, £11,104 million to £7,193
million. Non-interest income was severely affected by the weakness in
financial markets experienced over the course of the year. While the
decline was particularly marked in Global Banking & Market's credit
markets and equities businesses, with reduced business volumes and
mounting mark-to-market trading losses, Regional Markets also saw
non-interest income fall in the latter part of the year as declining
consumer confidence led to lower demand for credit and other financial
products.
Excluding general insurance premium income, non-interest income fell
by £11,343 million to £867 million.
Within non-interest income, fees and commissions receivable increased
by 19% or £1,553 million, to £9,831 million, while fees and commissions
payable increased by 9%, £193 million to £2,386 million.
Income from trading activities was down from £1,292 million to a loss of
£8,477 million. Currency trading activities benefited from increased
volatility in the markets. However, this improvement was more than offset
by substantial credit markets write downs during the year.
Other operating income also decreased, falling by 61%, £2,934 million
to £1,899 million. This was principally due to a fall in the fair value of
securities and other financial assets and liabilities partially offset by
profits from the sale of subsidiaries and associates.
Insurance premium income, after reinsurance, increased by
4% to £6,326 million primarily reflecting a full year of ABN AMRO
businesses in comparison with 76 days in 2007. This was partly offset by
the discontinuation of less profitable partnership contracts.