RBS 2008 Annual Report Download - page 53
Download and view the complete annual report
Please find page 53 of the 2008 RBS annual report below. You can navigate through the pages in the report by either clicking on the pages listed below, or by using the keyword search tool below to find specific information within the annual report.-
 1
1 -
2
-
3
-
4
-
5
-
6
-
7
-
8
-
9
-
10
-
11
-
12
-
13
-
14
-
15
-
16
-
17
-
18
-
19
-
20
-
21
-
22
-
23
-
24
-
25
-
26
-
27
-
28
-
29
-
30
-
31
-
32
-
33
-
34
-
35
-
36
-
37
-
38
-
39
-
40
-
41
-
42
-
 43
43 -
 44
44 -
 45
45 -
 46
46 -
 47
47 -
 48
48 -
 49
49 -
 50
50 -
 51
51 -
 52
52 -
 53
53 -
 54
54 -
 55
55 -
 56
56 -
 57
57 -
 58
58 -
 59
59 -
 60
60 -
 61
61 -
 62
62 -
 63
63 -
64
-
65
-
66
-
67
-
68
-
69
-
70
-
71
-
72
-
73
-
74
-
75
-
76
-
77
-
78
-
79
-
80
-
81
-
82
-
83
-
84
-
85
-
86
-
87
-
88
-
89
-
90
-
91
-
92
-
93
-
94
-
95
-
96
-
97
-
98
-
99
-
100
-
101
-
102
-
103
-
104
-
105
-
106
-
107
-
108
-
109
-
110
-
111
-
112
-
113
-
114
-
115
-
116
-
117
-
118
-
119
-
120
-
121
-
122
-
123
-
124
-
125
-
126
-
127
-
128
-
129
-
130
-
131
-
132
-
133
-
134
-
135
-
136
-
137
-
138
-
139
-
140
-
141
-
142
-
143
-
144
-
145
-
146
-
147
-
148
-
149
-
150
-
151
-
152
-
153
-
154
-
155
-
156
-
157
-
158
-
159
-
160
-
161
-
162
-
163
-
164
-
165
-
166
-
167
-
168
-
169
-
170
-
171
-
172
-
173
-
174
-
175
-
176
-
177
-
178
-
179
-
180
-
181
-
182
-
183
-
184
-
185
-
186
-
187
-
188
-
189
-
190
-
191
-
192
-
193
-
194
-
195
-
196
-
197
-
198
-
199
-
200
-
201
-
202
-
203
-
204
-
205
-
206
-
207
-
208
-
209
-
210
-
211
-
212
-
213
-
214
-
215
-
216
-
217
-
218
-
219
-
220
-
221
-
222
-
223
-
224
-
225
-
226
-
227
-
228
-
229
-
230
-
231
-
232
-
233
-
234
-
235
-
236
-
237
-
238
-
239
-
240
-
241
-
242
-
243
-
244
-
245
-
246
-
247
-
248
-
249
-
250
-
251
-
252
-
253
-
254
-
255
-
256
-
257
-
258
-
259
-
260
-
261
-
262
-
263
-
264
-
265
-
266
-
267
-
268
-
269
-
270
-
271
-
272
-
273
-
274
-
275
-
276
-
277
-
278
-
279
-
280
-
281
-
282
-
283
-
284
-
285
-
286
-
287
-
288
-
289
-
290
-
291
-
292
-
293
-
294
-
295
-
296
-
297
-
298
-
299
 |
 |

RBS Group Annual Report and Accounts 200852
Business review continued
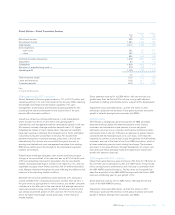
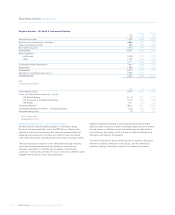
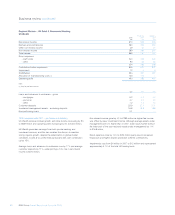
Equities saw reduced customer flow and also experienced losses on
illiquid trading positions as markets deteriorated rapidly, leading to a
drop in income from £1,169 million in 2007 to £415 million.
In a reduced market for debt origination, credit markets improved its
market positions in a number of key areas such as international bond
issuance. Results, however, were severely affected by the continuing
market weakness, with income, even excluding write-downs on
previously disclosed credit market exposures and one-off items, falling
by 50% to £1,366 million.
Asset and portfolio management income remained resilient, but some
losses were incurred, including on capital and credit exposure
management, and income declined by 28% to £2,415 million.
Direct expenses were reduced by 18% to £4,352 million, with staff
costs falling, despite the inclusion of Sempra, by 30% to £2,687 million,
as a result of a sharp reduction in bonus payments. Non-staff expenses
increased by 13%, principally reflecting increased transactional, legal
and professional costs, inflation and foreign exchange movements,
offset by reduced operating lease depreciation following the sale of
Angel Trains.
Credit impairments increased sharply to £3,643 million, including
£466 million on assets reclassified out of the held for trading category
following the amendments to IAS 39 issued in October. Of the total
impairment charge, £2,938 million was incurred in the fourth quarter
of 2008, including £918 million relating to the Group’s exposure to
Lyondell Basell.
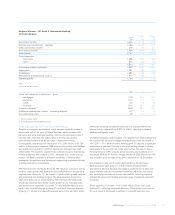
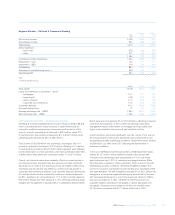
GBM’s total third party assets were reduced by £182 billion to £692
billion at 31 December 2008, a reduction of 21% from a year earlier, or
31% at constant exchange rates. Within this total, loans and advances
to customers were £354 billion, an increase of 14% at constant
exchange rates. This increase was more than offset by significant
reductions in reverse repos and securities holdings, both of which have
been managed down over the course of the year. Net derivative assets
totalled £146 billion, compared with £64 billion at the end of 2007.
Although GBM took steps to reduce underlying risk-weighted assets,
these measures were masked by the impact of foreign exchange
movements and of Basel II pro-cyclicality, with the result that RWAs at
31 December 2008 totalled £279 billion, up 31% from a year earlier, or
14% at constant exchange rates.
Strategic review
Following the review, GBM intends to focus its business around its core
corporate and institutional customer set across the world. These clients
are global in nature and are multi-product users. GBM will deploy
capital and resources in support of this customer base and will
continue to arrange and distribute credit (loans and bonds) and build
sustained competitive advantage in its core financing, risk management
and investment products, and flow trading businesses.
RBS is renewing its commitment to product areas where GBM has
market-leading competitive positions across its customer–centric
origination, advisory and trading activities. It has strong market positions
in loans, bonds, FX, rates, commodities and equities and will drive these
businesses, restructured where necessary, in a focused manner around
customers’ needs. GBM will discontinue all illiquid proprietary trading
activities and correlation trading, in equity and credit markets. It will
drastically scale back activity in structured real estate, leveraged and
project finance, and exit lending in these areas entirely. All businesses,
and notably GBM’s asset finance businesses, will be managed within
strict capital guidelines.
Globally, the intention is for GBM to move increasingly towards a “hub-
and-spoke” model. Risk will be managed from regional hubs. It is
intended that distribution and coverage will be delivered from a mix of
hub countries and a scaled-back presence in some local offices. The
aim, over time, will be to reduce much of the on-shore trading activity
outside the key financial centres.
Assets, products and geographies that fit GBM’s new client-focused
proposition will be defined as “core” and will remain within the division.
Assets, business lines and some geographies that are non-core will be
transferred to the new Non-Core Bank. These non-core activities
accounted for approximately £205 billion of third party assets at end 2008.
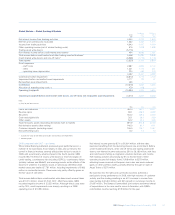
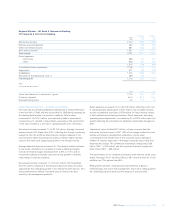
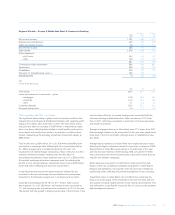
2008 compared with 2007 – statutory
Global Banking & Markets contribution fell from £3,653 million in 2007 to
a loss of £10,515 million. This sharp decline reflected the effect of the
market turmoil on the enlarged business.
Total income before credit market write-downs and one-off items and
trading asset write-downs was £10,214 million, up 19%. The increase
reflects good performances in a number of businesses, most notably in
rates and currencies and the inclusion of the ABN AMRO businesses
for a full twelve months. After credit market write-downs and one-off
items and trading asset write-down, GBM recorded negative income of
£2,520 million. Direct costs were up by 40%, with the inclusion of the
acquired business of ABN AMRO for a full year outweighing reduced
bonus payments. Credit impairments rose sharply from a very low level
(£67 million) to £3,177 million, resulting in a 2008 operating loss of
£10,994 million.