RBS 2008 Annual Report Download - page 246
Download and view the complete annual report
Please find page 246 of the 2008 RBS annual report below. You can navigate through the pages in the report by either clicking on the pages listed below, or by using the keyword search tool below to find specific information within the annual report.-
 1
1 -
2
-
3
-
4
-
5
-
6
-
7
-
8
-
9
-
10
-
11
-
12
-
13
-
14
-
15
-
16
-
17
-
18
-
19
-
20
-
21
-
22
-
23
-
24
-
25
-
26
-
27
-
28
-
29
-
30
-
31
-
32
-
33
-
34
-
35
-
36
-
37
-
38
-
39
-
40
-
41
-
42
-
43
-
44
-
45
-
46
-
47
-
48
-
49
-
50
-
51
-
52
-
53
-
54
-
55
-
56
-
57
-
58
-
59
-
60
-
61
-
62
-
63
-
64
-
65
-
66
-
67
-
68
-
69
-
70
-
71
-
72
-
73
-
74
-
75
-
76
-
77
-
78
-
79
-
80
-
81
-
82
-
83
-
84
-
85
-
86
-
87
-
88
-
89
-
90
-
91
-
92
-
93
-
94
-
95
-
96
-
97
-
98
-
99
-
100
-
101
-
102
-
103
-
104
-
105
-
106
-
107
-
108
-
109
-
110
-
111
-
112
-
113
-
114
-
115
-
116
-
117
-
118
-
119
-
120
-
121
-
122
-
123
-
124
-
125
-
126
-
127
-
128
-
129
-
130
-
131
-
132
-
133
-
134
-
135
-
136
-
137
-
138
-
139
-
140
-
141
-
142
-
143
-
144
-
145
-
146
-
147
-
148
-
149
-
150
-
151
-
152
-
153
-
154
-
155
-
156
-
157
-
158
-
159
-
160
-
161
-
162
-
163
-
164
-
165
-
166
-
167
-
168
-
169
-
170
-
171
-
172
-
173
-
174
-
175
-
176
-
177
-
178
-
179
-
180
-
181
-
182
-
183
-
184
-
185
-
186
-
187
-
188
-
189
-
190
-
191
-
192
-
193
-
194
-
195
-
196
-
197
-
198
-
199
-
200
-
201
-
202
-
203
-
204
-
205
-
206
-
207
-
208
-
209
-
210
-
211
-
212
-
213
-
214
-
215
-
216
-
217
-
218
-
219
-
220
-
221
-
222
-
223
-
224
-
225
-
226
-
227
-
228
-
229
-
230
-
231
-
232
-
233
-
234
-
235
-
 236
236 -
 237
237 -
 238
238 -
 239
239 -
 240
240 -
 241
241 -
 242
242 -
 243
243 -
 244
244 -
 245
245 -
 246
246 -
 247
247 -
 248
248 -
 249
249 -
 250
250 -
 251
251 -
 252
252 -
 253
253 -
 254
254 -
 255
255 -
 256
256 -
257
-
258
-
259
-
260
-
261
-
262
-
263
-
264
-
265
-
266
-
267
-
268
-
269
-
270
-
271
-
272
-
273
-
274
-
275
-
276
-
277
-
278
-
279
-
280
-
281
-
282
-
283
-
284
-
285
-
286
-
287
-
288
-
289
-
290
-
291
-
292
-
293
-
294
-
295
-
296
-
297
-
298
-
299
 |
 |

245RBS Group Annual Report and Accounts 2008
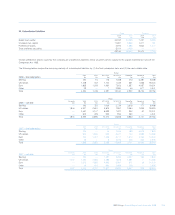
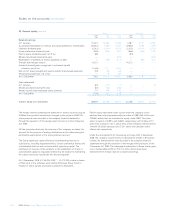
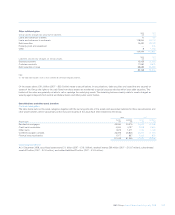
28 Owners’ equity Group Company
2008 2007 2006 2008 2007 2006
£m £m £m £m £m £m
Called-up share capital
At 1 January 2,530 815 826 2,530 815 826
Ordinary shares issued in respect of rights issue 1,531 ——1,531 ——
Ordinary shares issued in respect of capitalisation issue 101 ——101 ——
Ordinary shares issued in respect of placing and open offer 5,728 ——5,728 ——
Preference shares issued in respect of placing and open offer 5 —— 5——
Other shares issued 3 139 2 3139 2
Bonus issue of ordinary shares — 1,576 — —1,576 —
Shares repurchased — — (13) —— (13)
At 31 December 9,898 2,530 815 9,898 2,530 815
Paid-in equity
At 1 January 1,073 ——1,073 ——
Securities issued during the year — 1,073 — —1,073 —
At 31 December 1,073 1,073 — 1,073 1,073 —
Share premium account
At 1 January 17,322 12,482 11,777 17,322 12,482 11,777
Ordinary shares issued in respect of rights issue,
net of £246 million expenses 10,469 ——10,469 ——
Ordinary shares issued in respect of capitalisation issue (101) ——(101) ——
Expenses of placing and open offer (265) ——(265) ——
Other shares issued 46 6,257 815 46 6,257 815
Bonus issue of ordinary shares — (1,576) — —(1,576) —
Redemption of preference shares classified as debt — 159 271 —159 271
Shares repurchased — — (381) —— (381)
At 31 December 27,471 17,322 12,482 27,471 17,322 12,482
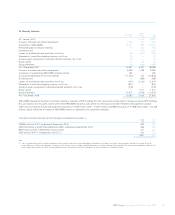
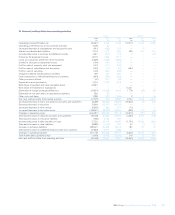
Merger reserve
At 1 January 10,881 10,881 10,881 ———
Placing and open offer 14,273 ——14,273 ——
Transfer to retained earnings (14,273) ——(14,273) ——
At 31 December 10,881 10,881 10,881 ———
Available-for-sale reserve
At 1 January 1,032 1,528 (73) ———
Unrealised (losses)/gains in the year (6,808) (191) 2,609 ———
Realised losses/(gains) in the year 842 (513) (313) ———
Tax 1,373 208 (695) ———
At 31 December (3,561) 1,032 1,528 ———
Cash flow hedging reserve
At 1 January (555) (149) 59 (5) (7) (9)
Amount recognised in equity during the year (603) (460) (109) ———
Amount transferred from equity to earnings in the year (1) 198 (138) (140) 233
Tax 84 192 41 (1) (1) (1)
At 31 December (876) (555) (149) (4) (5) (7)
Foreign exchange reserve
At 1 January (426) (872) 469 ———
Retranslation of net assets 11,970 1,339 (2,159) ———
Foreign currency (losses)/gains on hedges of net assets (2) (5,801) (963) 818 ———
Tax 642 70 — ———
At 31 December 6,385 (426) (872) ———
Capital redemption reserve
At 1 January 170 170 157 170 170 157
Shares repurchased during the year — — 13 —— 13
At 31 December 170 170 170 170 170 170
Notes:
(1) Of the amount transferred to earnings, £198 million (2007 – £138 million; 2006 – £140 million) was recorded in net interest income and nil (2007 and 2006 – nil) in other operating income.
(2) The hedging instruments in the majority of the Group’s net investment hedges are foreign currency borrowings, the effectiveness of these hedges is assessed prospectively (and on an ongoing
basis) by comparing expected (actual) changes in the fair value of the currency net investments in foreign operations and expected (actual) changes in the fair value of the external currency
liabilities (excluding accrued interest) attributable to changes in the spot exchange rate between the currency of the investment and sterling.