RBS 2008 Annual Report Download - page 197
Download and view the complete annual report
Please find page 197 of the 2008 RBS annual report below. You can navigate through the pages in the report by either clicking on the pages listed below, or by using the keyword search tool below to find specific information within the annual report.-
 1
1 -
2
-
3
-
4
-
5
-
6
-
7
-
8
-
9
-
10
-
11
-
12
-
13
-
14
-
15
-
16
-
17
-
18
-
19
-
20
-
21
-
22
-
23
-
24
-
25
-
26
-
27
-
28
-
29
-
30
-
31
-
32
-
33
-
34
-
35
-
36
-
37
-
38
-
39
-
40
-
41
-
42
-
43
-
44
-
45
-
46
-
47
-
48
-
49
-
50
-
51
-
52
-
53
-
54
-
55
-
56
-
57
-
58
-
59
-
60
-
61
-
62
-
63
-
64
-
65
-
66
-
67
-
68
-
69
-
70
-
71
-
72
-
73
-
74
-
75
-
76
-
77
-
78
-
79
-
80
-
81
-
82
-
83
-
84
-
85
-
86
-
87
-
88
-
89
-
90
-
91
-
92
-
93
-
94
-
95
-
96
-
97
-
98
-
99
-
100
-
101
-
102
-
103
-
104
-
105
-
106
-
107
-
108
-
109
-
110
-
111
-
112
-
113
-
114
-
115
-
116
-
117
-
118
-
119
-
120
-
121
-
122
-
123
-
124
-
125
-
126
-
127
-
128
-
129
-
130
-
131
-
132
-
133
-
134
-
135
-
136
-
137
-
138
-
139
-
140
-
141
-
142
-
143
-
144
-
145
-
146
-
147
-
148
-
149
-
150
-
151
-
152
-
153
-
154
-
155
-
156
-
157
-
158
-
159
-
160
-
161
-
162
-
163
-
164
-
165
-
166
-
167
-
168
-
169
-
170
-
171
-
172
-
173
-
174
-
175
-
176
-
177
-
178
-
179
-
180
-
181
-
182
-
183
-
184
-
185
-
186
-
 187
187 -
 188
188 -
 189
189 -
 190
190 -
 191
191 -
 192
192 -
 193
193 -
 194
194 -
 195
195 -
 196
196 -
 197
197 -
 198
198 -
 199
199 -
 200
200 -
 201
201 -
 202
202 -
 203
203 -
 204
204 -
 205
205 -
 206
206 -
 207
207 -
208
-
209
-
210
-
211
-
212
-
213
-
214
-
215
-
216
-
217
-
218
-
219
-
220
-
221
-
222
-
223
-
224
-
225
-
226
-
227
-
228
-
229
-
230
-
231
-
232
-
233
-
234
-
235
-
236
-
237
-
238
-
239
-
240
-
241
-
242
-
243
-
244
-
245
-
246
-
247
-
248
-
249
-
250
-
251
-
252
-
253
-
254
-
255
-
256
-
257
-
258
-
259
-
260
-
261
-
262
-
263
-
264
-
265
-
266
-
267
-
268
-
269
-
270
-
271
-
272
-
273
-
274
-
275
-
276
-
277
-
278
-
279
-
280
-
281
-
282
-
283
-
284
-
285
-
286
-
287
-
288
-
289
-
290
-
291
-
292
-
293
-
294
-
295
-
296
-
297
-
298
-
299
 |
 |

Notes on the accounts continued
RBS Group Annual Report and Accounts 2008196
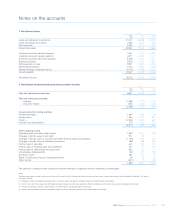
10 Earnings per ordinary share
The earnings per share are based on the following:
Group
2008 2007 2006
£m £m £m
Earnings:
(Loss)/profit attributable to ordinary shareholders (24,137) 7,303 6,202
Add back finance cost on dilutive convertible securities — 60 64
Diluted earnings attributable to ordinary shareholders (24,137) 7,363 6,266
Number of shares – millions
Number of ordinary shares:
Weighted average number of ordinary shares in issue during the year 16,563 11,413 11,411
Effect of dilutive share options and convertible securities — 198 208
Diluted weighted average number of ordinary shares during the year 16,563 11,611 11,619
The numbers of ordinary shares in issue in prior years have been adjusted retrospectively for the bonus element of the rights issue completed in
June 2008 and the capitalisation issue in September 2008. None of the convertible securities had a dilutive effect in 2008. All convertible securities
had a dilutive effect in 2007 and 2006 and have been included in the computation of diluted earnings per share.
The effect of discontinued operations on earnings per share is not material.
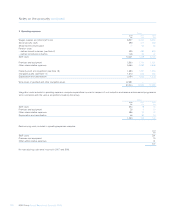
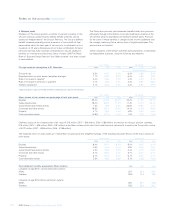
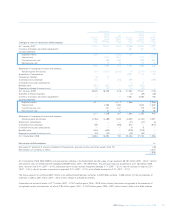
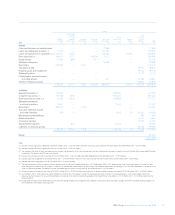
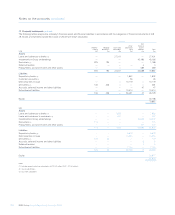
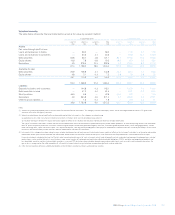
11 Financial instruments
Classification
The following tables analyse the Group’s financial assets and financial liabilities in accordance with the categories of financial instruments in IAS 39.
Assets and liabilities outside the scope of IAS 39 are shown separately.
Group
Designated
as at fair Non
value Other financial
Held-for- through Hedging Available- Loans and (amortised Finance assets/
trading profit or loss derivatives for-sale receivables cost) leases liabilities Total
2008 £m £m £m £m £m £m £m £m £m
Assets
Cash and balances at central banks —— —12,400 — 12,400
Loans and advances to banks (1) 56,234 ——81,963 — 138,197
Loans and advances to customers (2, 3) 51,501 2,141 — 806,627 14,453 874,722
Debt securities (4) 116,280 5,428 132,856 12,985 — 267,549
Equity shares 17,054 2,101 7,175 ——26,330
Settlement balances —— —17,832 — 17,832
Derivatives 985,700 — 6,859 —— — 992,559
Intangible assets —— — —20,049 20,049
Property, plant and equipment —— — 18,949 18,949
Deferred taxation —— —— —7,082 7,082
Prepayments, accrued income
and other assets —— —1,326 23,076 24,402
Assets of disposal groups —— — —1,581 1,581
1,226,769 9,670 6,859 140,031 933,133 14,453 70,737 2,401,652
Liabilities
Deposits by banks (5) 81,154 — 176,890 — 258,044
Customer accounts (6, 7) 55,926 8,054 575,532 — 639,512
Debt securities in issue (8, 9) 3,992 47,451 248,846 — 300,289
Settlement balances
and short positions 42,536 — 11,741 — 54,277
Derivatives 963,088 — 8,276 —— 971,364
Accruals, deferred income
and other liabilities 260 — 1,619 22 29,581 31,482
Retirement benefit liabilities 2,032 2,032
Deferred taxation 4,165 4,165
Insurance liabilities 9,976 9,976
Subordinated liabilities — 1,509 47,645 ——49,154
Liabilities of disposal groups ———859 859
1,146,956 57,014 8,276 1,062,273 22 46,613 2,321,154
Equity 80,498
2,401,652