RBS 2008 Annual Report Download - page 195
Download and view the complete annual report
Please find page 195 of the 2008 RBS annual report below. You can navigate through the pages in the report by either clicking on the pages listed below, or by using the keyword search tool below to find specific information within the annual report.-
 1
1 -
2
-
3
-
4
-
5
-
6
-
7
-
8
-
9
-
10
-
11
-
12
-
13
-
14
-
15
-
16
-
17
-
18
-
19
-
20
-
21
-
22
-
23
-
24
-
25
-
26
-
27
-
28
-
29
-
30
-
31
-
32
-
33
-
34
-
35
-
36
-
37
-
38
-
39
-
40
-
41
-
42
-
43
-
44
-
45
-
46
-
47
-
48
-
49
-
50
-
51
-
52
-
53
-
54
-
55
-
56
-
57
-
58
-
59
-
60
-
61
-
62
-
63
-
64
-
65
-
66
-
67
-
68
-
69
-
70
-
71
-
72
-
73
-
74
-
75
-
76
-
77
-
78
-
79
-
80
-
81
-
82
-
83
-
84
-
85
-
86
-
87
-
88
-
89
-
90
-
91
-
92
-
93
-
94
-
95
-
96
-
97
-
98
-
99
-
100
-
101
-
102
-
103
-
104
-
105
-
106
-
107
-
108
-
109
-
110
-
111
-
112
-
113
-
114
-
115
-
116
-
117
-
118
-
119
-
120
-
121
-
122
-
123
-
124
-
125
-
126
-
127
-
128
-
129
-
130
-
131
-
132
-
133
-
134
-
135
-
136
-
137
-
138
-
139
-
140
-
141
-
142
-
143
-
144
-
145
-
146
-
147
-
148
-
149
-
150
-
151
-
152
-
153
-
154
-
155
-
156
-
157
-
158
-
159
-
160
-
161
-
162
-
163
-
164
-
165
-
166
-
167
-
168
-
169
-
170
-
171
-
172
-
173
-
174
-
175
-
176
-
177
-
178
-
179
-
180
-
181
-
182
-
183
-
184
-
 185
185 -
 186
186 -
 187
187 -
 188
188 -
 189
189 -
 190
190 -
 191
191 -
 192
192 -
 193
193 -
 194
194 -
 195
195 -
 196
196 -
 197
197 -
 198
198 -
 199
199 -
 200
200 -
 201
201 -
 202
202 -
 203
203 -
 204
204 -
 205
205 -
206
-
207
-
208
-
209
-
210
-
211
-
212
-
213
-
214
-
215
-
216
-
217
-
218
-
219
-
220
-
221
-
222
-
223
-
224
-
225
-
226
-
227
-
228
-
229
-
230
-
231
-
232
-
233
-
234
-
235
-
236
-
237
-
238
-
239
-
240
-
241
-
242
-
243
-
244
-
245
-
246
-
247
-
248
-
249
-
250
-
251
-
252
-
253
-
254
-
255
-
256
-
257
-
258
-
259
-
260
-
261
-
262
-
263
-
264
-
265
-
266
-
267
-
268
-
269
-
270
-
271
-
272
-
273
-
274
-
275
-
276
-
277
-
278
-
279
-
280
-
281
-
282
-
283
-
284
-
285
-
286
-
287
-
288
-
289
-
290
-
291
-
292
-
293
-
294
-
295
-
296
-
297
-
298
-
299
 |
 |

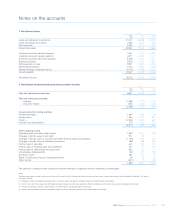
Notes on the accounts continued
RBS Group Annual Report and Accounts 2008194
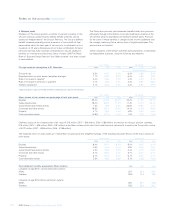
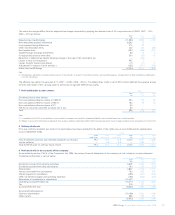
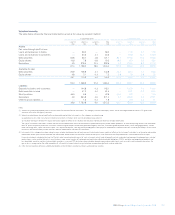
4 Pension costs (continued)
Main scheme All schemes
2008 2007 2006 2005 2004 2008 2007 2006 2005 2004
History of defined benefit schemes £m £m £m £m £m £m £m £m £m £m
Fair value of plan assets 14,804 18,575 17,374 15,914 13,569 25,756 27,662 18,959 17,388 14,798
Present value of defined
benefit obligations 15,594 18,099 19,004 19,118 16,051 27,752 27,547 20,951 21,123 17,738
Net (deficit)/surplus (790) 476 (1,630) (3,204) (2,482) (1,996) 115 (1,992) (3,735) (2,940)
Experience losses on plan liabilities (55) (256) (4) (41) (624) (65) (210) (19) (68) (631)
Experience gains on plan assets (4,784) 163 552 1,556 392 (6,051) 19 587 1,661 408
Actual return on pension
schemes assets (3,513) 1,345 1,574 2,486 1,230 (4,186) 1,413 1,660 2,677 1,328
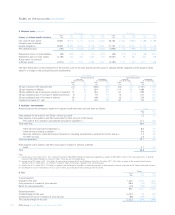
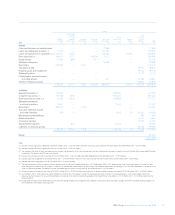
The table below sets out the sensitivities of the pension cost for the year and the present value of detailed benefit obligations at the balance sheet
dates to a change in the principal actuarial assumptions:
Main scheme All schemes
Increase/(decrease) Increase/(decrease)
in pension in obligation in pension in obligation
cost for the year at 31 December cost for the year at 31 December
2008 2007 2008 2007 2008 2007 2008 2007
£m £m £m £m £m £m £m £m
25 bps increase in the discount rate (37) (41) (696) (874) (53) (49) (1,161) (1,318)
25 bps increase in inflation 77 83 624 800 114 98 1,089 1,245
25 bps additional rate of increase in pensions in payment 41 43 383 461 63 51 695 760
25 bps additional rate of increase in deferred pensions 8 594 113 15 7227 239
25 bps additional rate of increase in salaries 28 35 168 216 35 40 219 265
Longevity increase of 1 year 31 31 302 390 50 37 700 761
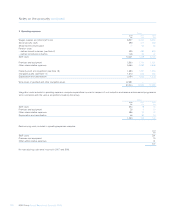
5 Auditors’ remuneration
Amounts paid to the company’s auditors for statutory audit and other services were as follows: Group
2008 2007
£m £m
Fees payable for the audit of the Group’s annual accounts 1.2 1.2
Fees payable to the auditors and their associates for other services to the Group:
– The audit of the company’s subsidiaries pursuant to legislation (1) 37.4 15.8
Total audit fees 38.6 17.0
– Other services pursuant to legislation (2) 8.6 4.9
– Other services relating to taxation 0.6 0.4
– Services relating to corporate finance transactions, including securitisations, entered into by the Group (3) 7.4 5.5
– All other services 3.5 3.4
Total non-audit fees 20.1 14.2
Fees payable to the auditors and their associates in respect of pension schemes:
– Audit 0.1 0.2
Total 58.8 31.4
Notes:
(1) Includes fees of £23.1 million (2007 – nil) in respect of the audit of ABN AMRO Holding N.V. Deloitte were appointed as auditors of ABN AMRO in 2008. In 2007, fees paid to Ernst & Young for
the audit of ABN AMRO Holding N.V. were £33.9 million. These fees are not included above.
(2) Includes fees of £5.5 million (2007 – £3.5 million) for work relating to Section 404 of the US Sarbanes-Oxley Act, £2.0 million (2007 – £0.2 million) in relation to the review of interim financial
statements and £1.1 million (2007 – £1.2 million) in respect of reports to the Group’s regulators in the UK and overseas.
(3) Includes fees of £3.1 million (2007 – £2.5 million) in respect of work performed by the auditors as reporting accountants on debt and equity issuances undertaken by the Group, including securitisations.
(4) Including other assurance and advisory services such as ad hoc accounting advice and reporting on internal controls.
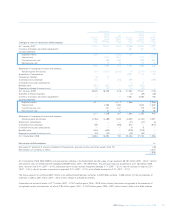
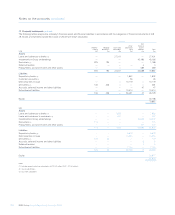
6 Tax Group
2008 2007 2006
£m £m £m
Current taxation:
Charge for the year 1,230 2,514 2,626
Over provision in respect of prior periods (254) (39) (253)
Relief for overseas taxation (34) (198) (147)
942 2,277 2,226
Deferred taxation:
(Credit)/charge for the year (3,167) 95 396
(Under)/over provision in respect of prior periods (98) (328) 67
Tax (credit)/charge for the year (2,323) 2,044 2,689