RBS 2008 Annual Report Download - page 143
Download and view the complete annual report
Please find page 143 of the 2008 RBS annual report below. You can navigate through the pages in the report by either clicking on the pages listed below, or by using the keyword search tool below to find specific information within the annual report.-
 1
1 -
2
-
3
-
4
-
5
-
6
-
7
-
8
-
9
-
10
-
11
-
12
-
13
-
14
-
15
-
16
-
17
-
18
-
19
-
20
-
21
-
22
-
23
-
24
-
25
-
26
-
27
-
28
-
29
-
30
-
31
-
32
-
33
-
34
-
35
-
36
-
37
-
38
-
39
-
40
-
41
-
42
-
43
-
44
-
45
-
46
-
47
-
48
-
49
-
50
-
51
-
52
-
53
-
54
-
55
-
56
-
57
-
58
-
59
-
60
-
61
-
62
-
63
-
64
-
65
-
66
-
67
-
68
-
69
-
70
-
71
-
72
-
73
-
74
-
75
-
76
-
77
-
78
-
79
-
80
-
81
-
82
-
83
-
84
-
85
-
86
-
87
-
88
-
89
-
90
-
91
-
92
-
93
-
94
-
95
-
96
-
97
-
98
-
99
-
100
-
101
-
102
-
103
-
104
-
105
-
106
-
107
-
108
-
109
-
110
-
111
-
112
-
113
-
114
-
115
-
116
-
117
-
118
-
119
-
120
-
121
-
122
-
123
-
124
-
125
-
126
-
127
-
128
-
129
-
130
-
131
-
132
-
 133
133 -
 134
134 -
 135
135 -
 136
136 -
 137
137 -
 138
138 -
 139
139 -
 140
140 -
 141
141 -
 142
142 -
 143
143 -
 144
144 -
 145
145 -
 146
146 -
 147
147 -
 148
148 -
 149
149 -
 150
150 -
 151
151 -
 152
152 -
 153
153 -
154
-
155
-
156
-
157
-
158
-
159
-
160
-
161
-
162
-
163
-
164
-
165
-
166
-
167
-
168
-
169
-
170
-
171
-
172
-
173
-
174
-
175
-
176
-
177
-
178
-
179
-
180
-
181
-
182
-
183
-
184
-
185
-
186
-
187
-
188
-
189
-
190
-
191
-
192
-
193
-
194
-
195
-
196
-
197
-
198
-
199
-
200
-
201
-
202
-
203
-
204
-
205
-
206
-
207
-
208
-
209
-
210
-
211
-
212
-
213
-
214
-
215
-
216
-
217
-
218
-
219
-
220
-
221
-
222
-
223
-
224
-
225
-
226
-
227
-
228
-
229
-
230
-
231
-
232
-
233
-
234
-
235
-
236
-
237
-
238
-
239
-
240
-
241
-
242
-
243
-
244
-
245
-
246
-
247
-
248
-
249
-
250
-
251
-
252
-
253
-
254
-
255
-
256
-
257
-
258
-
259
-
260
-
261
-
262
-
263
-
264
-
265
-
266
-
267
-
268
-
269
-
270
-
271
-
272
-
273
-
274
-
275
-
276
-
277
-
278
-
279
-
280
-
281
-
282
-
283
-
284
-
285
-
286
-
287
-
288
-
289
-
290
-
291
-
292
-
293
-
294
-
295
-
296
-
297
-
298
-
299
 |
 |

Business review continued
RBS Group Annual Report and Accounts 2008142
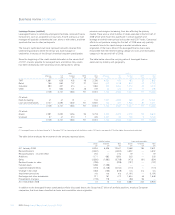
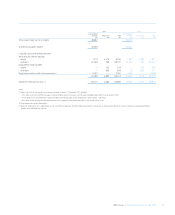
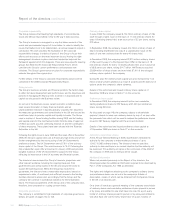
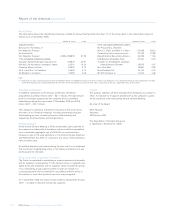
The Group’s exposure from the conduit shared with the other consortium members is set out below:
2008 2007
£m £m
Total assets held by the conduits 13,286 10,650
Commercial paper issued 13,028 10,452
Liquidity and credit enhancements:
deal specific drawn liquidity
– drawn 258 198
– undrawn 13,566 11,868
13,824 12,066
Maximum exposure to loss 13,824 12,066
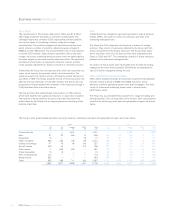
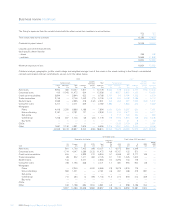
Collateral analysis, geographic, profile, credit ratings and weighted average lives of the assets in the assets relating to the Group’s consolidated
conduits and related undrawn commitments are set out in the tables below.
2008 2007
Liquidity Liquidity
Funded assets from third Total Funded assets from third Total
Loans Securities Total Undrawn parties exposure Loans Securities Total Undrawn parties exposure
£m £m £m £m £m £m £m £m £m £m £m £m
Auto loans 9,924 383 10,307 1,871 — 12,178 8,066 578 8,644 3,701 (102) 12,243
Corporate loans 430 11,042 11,472 534 — 12,006 36 8,927 8,963 1,390 — 10,353
Credit card receivables 5,844 — 5,844 922 — 6,766 5,104 90 5,194 1,206 — 6,400
Trade receivables 2,745 — 2,745 1,432 (71) 4,106 3,068 320 3,388 2,386 — 5,774
Student loans 2,555 — 2,555 478 (132) 2,901 335 262 597 1,082 (132) 1,547
Consumer loans 2,371 — 2,371 409 — 2,780 1,886 — 1,886 403 — 2,289
Mortgages
Prime 4,416 2,250 6,666 1,188 — 7,854 4,424 2,263 6,687 664 — 7,351
Non-conforming 2,181 — 2,181 727 — 2,908 2,343 234 2,577 740 — 3,317
Sub-prime —————— 9 117 126 363 — 489
Commercial 1,228 507 1,735 66 (23) 1,778 799 1,094 1,893 168 (23) 2,038
Buy-to-let ——————— 61 61 8—69
CDOs ——————— 2,129 2,129 268 — 2,397
Other 1,851 2,130 3,981 1,615 — 5,596 2,976 2,947 5,923 2,433 — 8,356
33,545 16,312 49,857 9,242 (226) 58,873 29,046 19,022 48,068 14,812 (257) 62,623
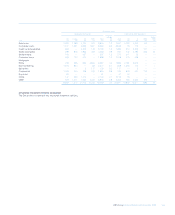
CP funded assets
Geographic distribution Credit ratings (S&P equivalent)
Weighted
average Below
UK Europe US ROW Total life AAA AA A BBB BBB
2008 £m £m £m £m £m £m £m £m £m £m £m
Auto loans 801 1,706 7,402 398 10,307 1.7 6,075 883 3,349 ——
Corporate loans 1,714 4,347 3,289 2,122 11,472 4.9 10,767 132 573 ——
Credit card receivables 633 — 4,999 212 5,844 0.7 3,465 62 2,171 146 —
Trade receivables 68 922 1,371 384 2,745 0.7 120 1,025 1,600 ——
Student loans 144 — 2,411 — 2,555 0.3 2,296 144 115 ——
Consumer loans 708 1,195 468 — 2,371 1.7 387 993 923 68 —
Mortgages
Prime — 2,244 — 4,422 6,666 2.8 2,675 3,876 115 ——
Non-conforming 960 1,221 ——2,181 4.6 351 368 475 987 —
Sub-prime ———————————
Commercial 713 453 74 495 1,735 11.0 274 518 474 469 —
Buy-to-let ———————————
CDOs ———————————
Other 166 1,198 684 1,933 3,981 3.5 3 958 2,786 234 —
5,907 13,286 20,698 9,966 49,857 2.8 26,413 8,959 12,581 1,904 —