RBS 2008 Annual Report Download - page 218
Download and view the complete annual report
Please find page 218 of the 2008 RBS annual report below. You can navigate through the pages in the report by either clicking on the pages listed below, or by using the keyword search tool below to find specific information within the annual report.-
 1
1 -
2
-
3
-
4
-
5
-
6
-
7
-
8
-
9
-
10
-
11
-
12
-
13
-
14
-
15
-
16
-
17
-
18
-
19
-
20
-
21
-
22
-
23
-
24
-
25
-
26
-
27
-
28
-
29
-
30
-
31
-
32
-
33
-
34
-
35
-
36
-
37
-
38
-
39
-
40
-
41
-
42
-
43
-
44
-
45
-
46
-
47
-
48
-
49
-
50
-
51
-
52
-
53
-
54
-
55
-
56
-
57
-
58
-
59
-
60
-
61
-
62
-
63
-
64
-
65
-
66
-
67
-
68
-
69
-
70
-
71
-
72
-
73
-
74
-
75
-
76
-
77
-
78
-
79
-
80
-
81
-
82
-
83
-
84
-
85
-
86
-
87
-
88
-
89
-
90
-
91
-
92
-
93
-
94
-
95
-
96
-
97
-
98
-
99
-
100
-
101
-
102
-
103
-
104
-
105
-
106
-
107
-
108
-
109
-
110
-
111
-
112
-
113
-
114
-
115
-
116
-
117
-
118
-
119
-
120
-
121
-
122
-
123
-
124
-
125
-
126
-
127
-
128
-
129
-
130
-
131
-
132
-
133
-
134
-
135
-
136
-
137
-
138
-
139
-
140
-
141
-
142
-
143
-
144
-
145
-
146
-
147
-
148
-
149
-
150
-
151
-
152
-
153
-
154
-
155
-
156
-
157
-
158
-
159
-
160
-
161
-
162
-
163
-
164
-
165
-
166
-
167
-
168
-
169
-
170
-
171
-
172
-
173
-
174
-
175
-
176
-
177
-
178
-
179
-
180
-
181
-
182
-
183
-
184
-
185
-
186
-
187
-
188
-
189
-
190
-
191
-
192
-
193
-
194
-
195
-
196
-
197
-
198
-
199
-
200
-
201
-
202
-
203
-
204
-
205
-
206
-
207
-
 208
208 -
 209
209 -
 210
210 -
 211
211 -
 212
212 -
 213
213 -
 214
214 -
 215
215 -
 216
216 -
 217
217 -
 218
218 -
 219
219 -
 220
220 -
 221
221 -
 222
222 -
 223
223 -
 224
224 -
 225
225 -
 226
226 -
 227
227 -
 228
228 -
229
-
230
-
231
-
232
-
233
-
234
-
235
-
236
-
237
-
238
-
239
-
240
-
241
-
242
-
243
-
244
-
245
-
246
-
247
-
248
-
249
-
250
-
251
-
252
-
253
-
254
-
255
-
256
-
257
-
258
-
259
-
260
-
261
-
262
-
263
-
264
-
265
-
266
-
267
-
268
-
269
-
270
-
271
-
272
-
273
-
274
-
275
-
276
-
277
-
278
-
279
-
280
-
281
-
282
-
283
-
284
-
285
-
286
-
287
-
288
-
289
-
290
-
291
-
292
-
293
-
294
-
295
-
296
-
297
-
298
-
299
 |
 |

217RBS Group Annual Report and Accounts 2008
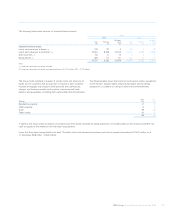
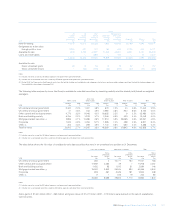
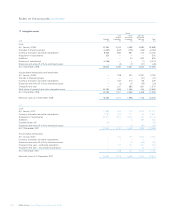
Group
UK US Other Mortgage and
central central central Bank and other asset
and local and local and local building backed
government government government society securities(1) Corporate Other(2) Total
2007 £m £m £m £m £m £m £m £m
Held-for-trading 10,370 12,670 60,356 7,830 62,430 35,769 1,246 190,671
Designated as at fair value
through profit or loss 2,235 397 101 154 340 2,125 425 5,777
Available-for-sale 1,030 2,169 31,597 11,835 36,607 6,551 5,747 95,536
Loans and receivables ——1,896 — 704 — 72 2,672
13,635 15,236 93,950 19,819 100,081 44,445 7,490 294,656
Available-for-sale
Gross unrealised gains 29 14 56 12 18 22 1 152
Gross unrealised losses — (62) (276) (42) (181) (22) (10) (593)
Notes:
(1) Includes securities issued by US federal agencies and government sponsored entities.
(2) Includes non asset backed securities issued by US federal agencies and government sponsored entities.
(3) During 2008 the Group reclassified financial assets from the held-for-trading and available-for-sale categories into the loans and receivables category and from the held-for-trading category into
the available-for-sale category (see page 208).
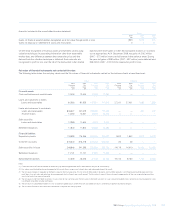
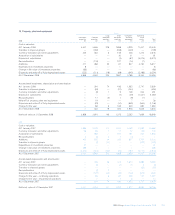
The following table analyses by issuer the Group’s available-for-sale debt securities by remaining maturity and the related yield (based on weighted
averages).
After 1 but After 5 but
Within 1 year within 5 years within 10 years After 10 years Total
Amount Yield Amount Yield Amount Yield Amount Yield Amount Yield
2008 £m % £m % £m % £m % £m %
UK central and local government 9,320 2.0% 1,307 3.8% 670 7.2% 33 4.6% 11,330 2.5%
US central and local government 37 3.6% 232 3.9% 4,980 3.8% 903 5.6% 6,152 4.0%
Other central and local government 4,770 3.5% 9,046 4.3% 18,655 3.2% 9 3.2% 32,480 3.5%
Bank and building society 5,753 2.2% 3,919 3.7% 2,046 4.8% 320 3.3% 12,038 3.0%
Mortgage-backed securities (1) 2,806 4.1% 13,286 2.6% 17,510 3.9% 28,465 4.6% 62,067 3.9%
Corporate 1,024 4.6% 3,454 5.1% 1,565 7.4% 458 3.5% 6,501 5.4%
Other (2) 202 3.4% 298 3.9% 1,134 4.5% 654 4.4% 2,288 4.2%
Total fair value 23,912 2.7% 31,542 3.5% 46,560 3.8% 30,842 4.6% 132,856 3.7%
Notes:
(1) Includes securities issued by US federal agencies and government sponsored entities.
(2) Includes non asset backed securities issued by US federal agencies and government sponsored entities.
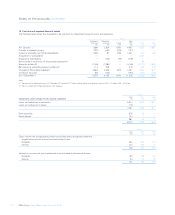
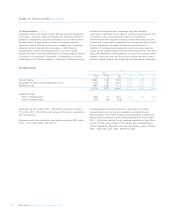
The table below shows the fair value of available-for-sale debt securities that were in an unrealised loss position at 31 December.
Less than 12 months More than 12 months Total
Gross Gross Gross
unrealised unrealised unrealised
Fair value losses Fair value losses Fair value losses
2008 £m £m £m £m £m £m
US central and local government 260 3 10,777 163 11,037 166
Other central and local government 17,939 3,450 39 7 17,978 3,457
Bank and building society 1,402 95 1,192 51 2,594 146
Mortgage-backed securities (1) 15,032 2,840 25,033 693 40,065 3,533
Corporate 618 267 2,326 181 2,944 448
Other (2) 91235 79 244 80
35,260 6,656 39,602 1,174 74,862 7,830
Notes:
(1) Includes securities issued by US federal agencies and government sponsored entities.
(2) Includes non asset-backed securities issued by US federal agencies and government sponsored entities.
Gross gains of £1,633 million (2007 – £60 million) and gross losses of £1,411 million (2007 – £12 million) were realised on the sale of available-for-
sale securities.