RBS 2008 Annual Report Download - page 110
Download and view the complete annual report
Please find page 110 of the 2008 RBS annual report below. You can navigate through the pages in the report by either clicking on the pages listed below, or by using the keyword search tool below to find specific information within the annual report.-
 1
1 -
2
-
3
-
4
-
5
-
6
-
7
-
8
-
9
-
10
-
11
-
12
-
13
-
14
-
15
-
16
-
17
-
18
-
19
-
20
-
21
-
22
-
23
-
24
-
25
-
26
-
27
-
28
-
29
-
30
-
31
-
32
-
33
-
34
-
35
-
36
-
37
-
38
-
39
-
40
-
41
-
42
-
43
-
44
-
45
-
46
-
47
-
48
-
49
-
50
-
51
-
52
-
53
-
54
-
55
-
56
-
57
-
58
-
59
-
60
-
61
-
62
-
63
-
64
-
65
-
66
-
67
-
68
-
69
-
70
-
71
-
72
-
73
-
74
-
75
-
76
-
77
-
78
-
79
-
80
-
81
-
82
-
83
-
84
-
85
-
86
-
87
-
88
-
89
-
90
-
91
-
92
-
93
-
94
-
95
-
96
-
97
-
98
-
99
-
 100
100 -
 101
101 -
 102
102 -
 103
103 -
 104
104 -
 105
105 -
 106
106 -
 107
107 -
 108
108 -
 109
109 -
 110
110 -
 111
111 -
 112
112 -
 113
113 -
 114
114 -
 115
115 -
 116
116 -
 117
117 -
 118
118 -
 119
119 -
 120
120 -
121
-
122
-
123
-
124
-
125
-
126
-
127
-
128
-
129
-
130
-
131
-
132
-
133
-
134
-
135
-
136
-
137
-
138
-
139
-
140
-
141
-
142
-
143
-
144
-
145
-
146
-
147
-
148
-
149
-
150
-
151
-
152
-
153
-
154
-
155
-
156
-
157
-
158
-
159
-
160
-
161
-
162
-
163
-
164
-
165
-
166
-
167
-
168
-
169
-
170
-
171
-
172
-
173
-
174
-
175
-
176
-
177
-
178
-
179
-
180
-
181
-
182
-
183
-
184
-
185
-
186
-
187
-
188
-
189
-
190
-
191
-
192
-
193
-
194
-
195
-
196
-
197
-
198
-
199
-
200
-
201
-
202
-
203
-
204
-
205
-
206
-
207
-
208
-
209
-
210
-
211
-
212
-
213
-
214
-
215
-
216
-
217
-
218
-
219
-
220
-
221
-
222
-
223
-
224
-
225
-
226
-
227
-
228
-
229
-
230
-
231
-
232
-
233
-
234
-
235
-
236
-
237
-
238
-
239
-
240
-
241
-
242
-
243
-
244
-
245
-
246
-
247
-
248
-
249
-
250
-
251
-
252
-
253
-
254
-
255
-
256
-
257
-
258
-
259
-
260
-
261
-
262
-
263
-
264
-
265
-
266
-
267
-
268
-
269
-
270
-
271
-
272
-
273
-
274
-
275
-
276
-
277
-
278
-
279
-
280
-
281
-
282
-
283
-
284
-
285
-
286
-
287
-
288
-
289
-
290
-
291
-
292
-
293
-
294
-
295
-
296
-
297
-
298
-
299
 |
 |
109RBS Group Annual Report and Accounts 2008
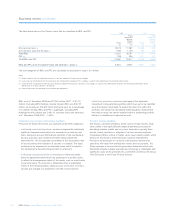
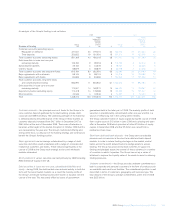
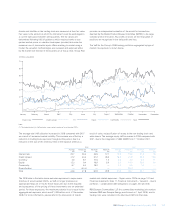
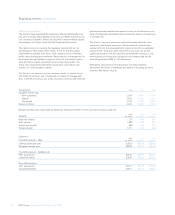
Assets and liabilities in the trading book are measured at their fair value.
Fair value is the amount at which the instrument could be exchanged in
a current transaction between willing parties. The fair values are
determined following IAS 39 guidance which requires banks to use
quoted market prices or valuation techniques (models) that make the
maximum use of observable inputs. When marking to market using a
model, the valuation methodologies are reviewed and approved either
by the market risk function in the business or at Group level. Group Risk
provides an independent evaluation of the model for transactions
deemed by the Model Product Review Committee (MPRC) to be large,
complex and/or innovative. Any profits or losses on the revaluation of
positions are recognised in the daily profit and loss.
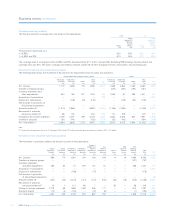
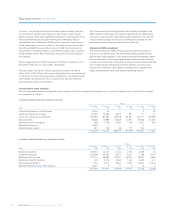
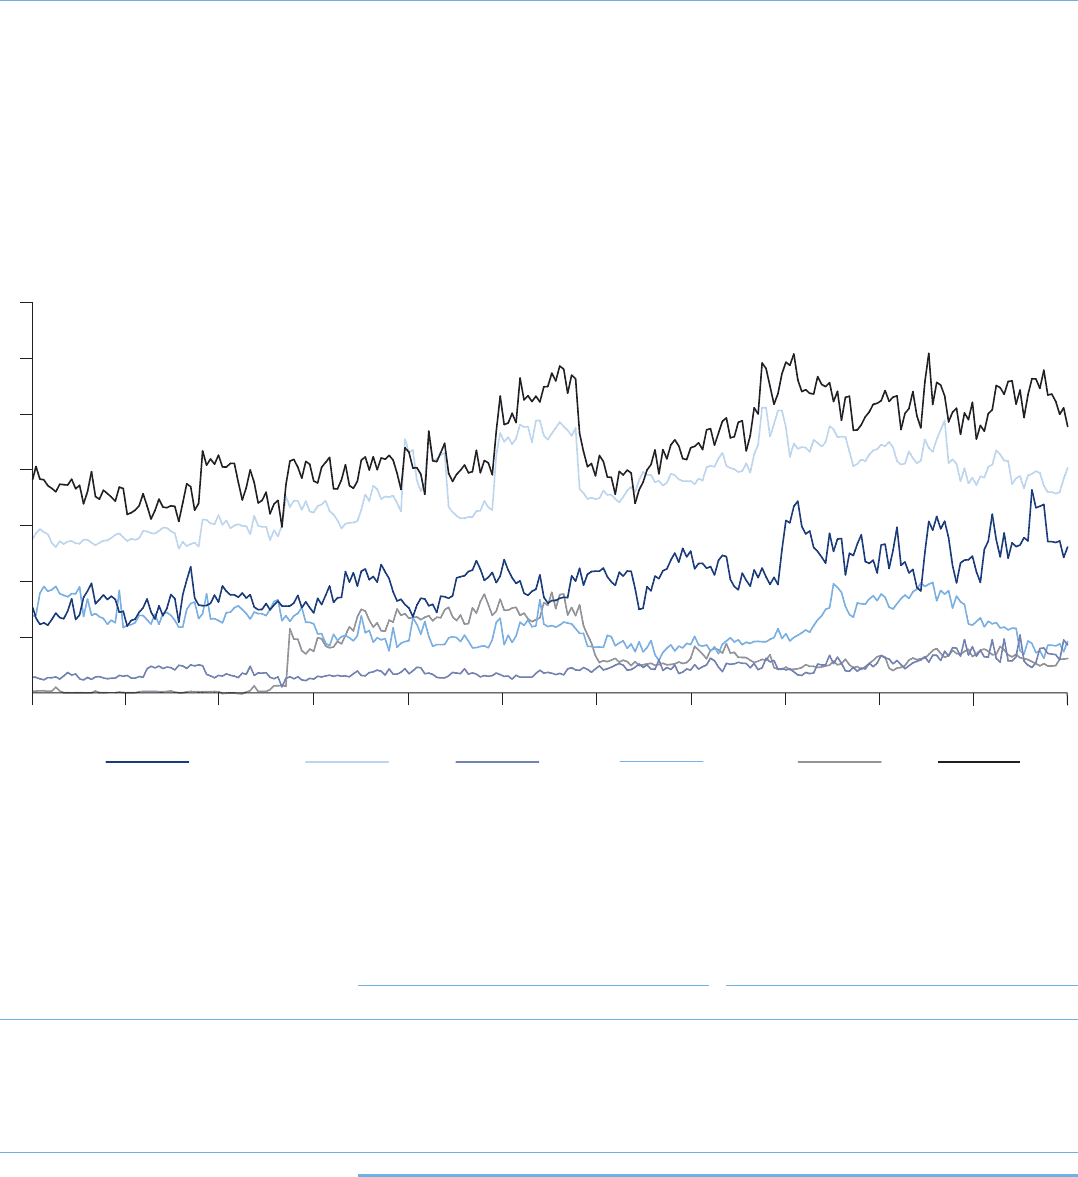
The VaR for the Group’s 2008 trading portfolios segregated by type of
market risk exposure is shown below.
10
20
30
40
50
60
70
January February March April May June July August September October November December
£ million (unaudited)
Interest rate Credit spread FX Equity Commodity Total
2008 2007
Average Period end Maximum Minimum Average Period end Maximum Minimum
£m £m £m £m £m £m £m £m
Interest rate 20.7 26.3 36.5 12.1 12.5 15.0 21.8 7.6
Credit spread 37.2 40.4 51.2 26.0 18.8 41.9 45.2 12.6
Currency 4.5 8.7 10.5 1.2 2.6 3.0 6.9 1.1
Equity 12.3 9.4 19.9 6.0 5.4 14.0 22.0 1.4
Commodity 6.7 6.3 18.2 — 0.2 0.5 1.6 —
Diversification — (43.3) ——— (28.7) ——
Total 44.6 47.8 60.9 29.9 21.6 45.7 50.1 13.2
Note:
(1) The traded market risk VaR excludes super senior tranches of asset backed CDOs.
The average total VaR utilisation increased in 2008 compared with 2007
as a result of increased market volatility. This increase was offset by a
reduction in trading book exposure throughout the period, due to a
reduction in the size of the inventory held on the balance sheet as a
result of sales, reclassification of assets to the non-trading book and
write-downs. The average equity VaR increased in 2008 compared with
2007, due to the integration of ABN AMRO from 17 October 2007.
The 2008 data in the table above excludes exposures to super-senior
tranches of asset backed CDOs, as VaR no longer produces an
appropriate measure of risk for these exposures due to the illiquidity
and opaqueness of the pricing of these instruments over an extended
period. For these exposures, the maximum potential loss is equal to the
aggregate net exposure, which was £1,398 million as at 31 December
2008. For more information, please refer to the discussion of Credit
market and related exposures – Super senior CDOs on page 132 and
Financial statements: Note 11, Financial instruments – Valuation – level 3
portfolios – collateralised debt obligations on pages 204 and 205.
RBS Sempra Commodities LLP, the commodities-marketing joint venture
between RBS and Sempra Energy, was formed on 1 April 2008, and its
trading risks were included in the disclosed VaR from that date.