RBS 2008 Annual Report Download - page 128
Download and view the complete annual report
Please find page 128 of the 2008 RBS annual report below. You can navigate through the pages in the report by either clicking on the pages listed below, or by using the keyword search tool below to find specific information within the annual report.-
 1
1 -
2
-
3
-
4
-
5
-
6
-
7
-
8
-
9
-
10
-
11
-
12
-
13
-
14
-
15
-
16
-
17
-
18
-
19
-
20
-
21
-
22
-
23
-
24
-
25
-
26
-
27
-
28
-
29
-
30
-
31
-
32
-
33
-
34
-
35
-
36
-
37
-
38
-
39
-
40
-
41
-
42
-
43
-
44
-
45
-
46
-
47
-
48
-
49
-
50
-
51
-
52
-
53
-
54
-
55
-
56
-
57
-
58
-
59
-
60
-
61
-
62
-
63
-
64
-
65
-
66
-
67
-
68
-
69
-
70
-
71
-
72
-
73
-
74
-
75
-
76
-
77
-
78
-
79
-
80
-
81
-
82
-
83
-
84
-
85
-
86
-
87
-
88
-
89
-
90
-
91
-
92
-
93
-
94
-
95
-
96
-
97
-
98
-
99
-
100
-
101
-
102
-
103
-
104
-
105
-
106
-
107
-
108
-
109
-
110
-
111
-
112
-
113
-
114
-
115
-
116
-
117
-
 118
118 -
 119
119 -
 120
120 -
 121
121 -
 122
122 -
 123
123 -
 124
124 -
 125
125 -
 126
126 -
 127
127 -
 128
128 -
 129
129 -
 130
130 -
 131
131 -
 132
132 -
 133
133 -
 134
134 -
 135
135 -
 136
136 -
 137
137 -
 138
138 -
139
-
140
-
141
-
142
-
143
-
144
-
145
-
146
-
147
-
148
-
149
-
150
-
151
-
152
-
153
-
154
-
155
-
156
-
157
-
158
-
159
-
160
-
161
-
162
-
163
-
164
-
165
-
166
-
167
-
168
-
169
-
170
-
171
-
172
-
173
-
174
-
175
-
176
-
177
-
178
-
179
-
180
-
181
-
182
-
183
-
184
-
185
-
186
-
187
-
188
-
189
-
190
-
191
-
192
-
193
-
194
-
195
-
196
-
197
-
198
-
199
-
200
-
201
-
202
-
203
-
204
-
205
-
206
-
207
-
208
-
209
-
210
-
211
-
212
-
213
-
214
-
215
-
216
-
217
-
218
-
219
-
220
-
221
-
222
-
223
-
224
-
225
-
226
-
227
-
228
-
229
-
230
-
231
-
232
-
233
-
234
-
235
-
236
-
237
-
238
-
239
-
240
-
241
-
242
-
243
-
244
-
245
-
246
-
247
-
248
-
249
-
250
-
251
-
252
-
253
-
254
-
255
-
256
-
257
-
258
-
259
-
260
-
261
-
262
-
263
-
264
-
265
-
266
-
267
-
268
-
269
-
270
-
271
-
272
-
273
-
274
-
275
-
276
-
277
-
278
-
279
-
280
-
281
-
282
-
283
-
284
-
285
-
286
-
287
-
288
-
289
-
290
-
291
-
292
-
293
-
294
-
295
-
296
-
297
-
298
-
299
 |
 |

127
RBS Group Annual Report and Accounts 2008
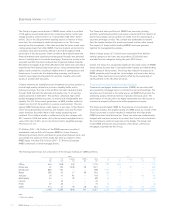
Residential mortgage-backed securities (audited)
Residential mortgage backed securities (RMBS) are securities that
represent an interest in a portfolio of residential mortgages.
Repayments made on the underlying mortgages are used to make
payments to holders of the RMBS. The risk of the RMBS will vary
primarily depending on the quality and geographic region of the
underlying mortgage assets and the credit enhancement of the
securitisation structure.
Several tranches of notes are issued, each secured against the same
portfolio of mortgages, but providing differing levels of seniority to
match the risk appetite of investors. The most junior (or equity) notes will
suffer early capital and interest losses experienced by the referenced
mortgage collateral, with each more senior note benefiting from the
protection provided by the subordinated notes below. Additional credit
enhancements may be provided to the holder of senior RMBS notes,
including guarantees over the value of the exposures, often provided by
monoline insurers.
The main categories of mortgages that serve as collateral to RMBS held
by the Group are described below. As can be seen from the table
below, the Group’s RMBS portfolio covers a range of geographic
locations and different categories are used to classify the exposures
depending on the geographical region of the underlying mortgage.
These categories are described below. The US market has more
established definitions of differing underlying mortgage quality and
these are used as the basis for the Group’s RMBS categorisation.
Sub-prime mortgages: are loans to sub-prime borrowers typically
having weakened credit histories that include payment delinquencies,
and potentially more severe problems such as court judgements and
bankruptcies. They may also display reduced repayment capacity as
measured by credit scores, high debt-to-income ratios, or other criteria
indicating heightened risk of default.
Non-conforming mortgages (or ‘Alt-A’ used for US exposure) have a
higher credit quality than sub-prime mortgages, but lower than those
prime borrowers. Within the US mortgage industry, non-conforming
mortgages are those that do not meet the lending criteria for US agency
mortgages (described below). For non-US mortgages, judgement is
applied in identifying loans with similar characteristics to US non-
conforming loans and also include self-certified loans. Alt-A describes a
category of mortgages in which lenders consider the risk to be greater
than prime mortgages though less than sub-prime. The offered interest
rate is usually representative of the associated risk level.
Guaranteed mortgages are mortgages that form part of a mortgage
backed security issuance by a government agency, or in the US an
entity that benefits from a guarantee (direct or indirect) provided by the
US government. For US RMBS, this category includes, amongst others,
RMBS issued by Ginnie Mae, Freddie Mac and Fannie Mae. For
European RMBS, this includes mortgages guaranteed by the Dutch
Government.
Other prime mortgages are those of a higher credit quality than non-
conforming and sub-prime mortgages, and exclude guaranteed
mortgages.
Covered mortgage bonds are debt instruments that have recourse to a
pool of mortgage assets, where investors have a preferred claim if a
default occurs. These underlying assets are segregated from the other
assets held by the issuing entity. These underlying assets are
segregated from other assets held by the issuing entity.
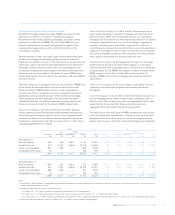
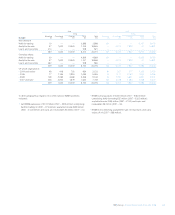
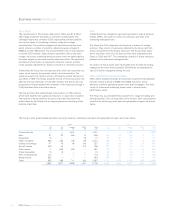
The tables below show the Group’s RMBS net exposures and carrying
values by measurement classification, underlying asset type, the main
geographical locations of the property that the mortgage is secured
against, and the year in which the underlying mortgage was originated.
2008 2007
Non Prime Non Prime
Sub-prime conforming Guaranteed(2) Other(3) Total Sub-prime conforming Guaranteed(2) Other(3) Total
£m £m £m £m £m £m £m £m £m £m
Net exposure: (1)
Held-for-trading 345 346 18,631 5,140 24,462 3,497 2,913 15,627 13,068 35,105
Available-for-sale 572 2,184 22,546 19,148 44,450 139 865 16,539 10,332 27,875
Loans and receivables 527 1,482 — 569 2,578 5——— 5
Designated at fair value 16 ——166 182 18 ——72 90
1,460 4,012 41,177 25,023 71,672 3,659 3,778 32,166 23,472 63,075
Carrying values: (2)
Held-for-trading 1,594 352 18,631 7,272 27,849 5,073 2,913 15,627 13,667 37,280
Available-for-sale 913 2,183 22,546 19,149 44,791 139 865 16,545 10,331 27,880
Loans and receivables 566 1,482 — 570 2,618 5——— 5
Designated at fair value 16 ——166 182 18 ——72 90
3,089 4,017 41,177 27,157 75,440 5,235 3,778 32,172 24,070 65,255
Notes:
(1) Net exposures reflect the effect of hedge protection purchased from monolines and other counterparties but excludes the effect of counterparty credit valuation adjustment. Carrying value is the
amount recorded on the balance sheet.
(2) Prime guaranteed exposures and carrying values include:
• £7.6 billion (2007 – £6.0 billion) available-for-sale exposures guaranteed by the Dutch government
• £5.7 billion (2007 – £5.0 billion) guaranteed by US government via Ginnie Mae of which £0.5 billion (2007 – £0.3 billion) are held-for-trading
• £27.8 billion (2007 – £ 21.0 million) effectively guaranteed by the US government via its support for Freddie Mac and Fannie Mae of which £18.1 billon (2007 – £15.2 billion) are held-for-trading
(3) Other prime mortgage exposures include £10.0 billion (2007 – £7.8 billion) covered European mortgage bonds.