RBS 2008 Annual Report Download - page 233
Download and view the complete annual report
Please find page 233 of the 2008 RBS annual report below. You can navigate through the pages in the report by either clicking on the pages listed below, or by using the keyword search tool below to find specific information within the annual report.-
 1
1 -
2
-
3
-
4
-
5
-
6
-
7
-
8
-
9
-
10
-
11
-
12
-
13
-
14
-
15
-
16
-
17
-
18
-
19
-
20
-
21
-
22
-
23
-
24
-
25
-
26
-
27
-
28
-
29
-
30
-
31
-
32
-
33
-
34
-
35
-
36
-
37
-
38
-
39
-
40
-
41
-
42
-
43
-
44
-
45
-
46
-
47
-
48
-
49
-
50
-
51
-
52
-
53
-
54
-
55
-
56
-
57
-
58
-
59
-
60
-
61
-
62
-
63
-
64
-
65
-
66
-
67
-
68
-
69
-
70
-
71
-
72
-
73
-
74
-
75
-
76
-
77
-
78
-
79
-
80
-
81
-
82
-
83
-
84
-
85
-
86
-
87
-
88
-
89
-
90
-
91
-
92
-
93
-
94
-
95
-
96
-
97
-
98
-
99
-
100
-
101
-
102
-
103
-
104
-
105
-
106
-
107
-
108
-
109
-
110
-
111
-
112
-
113
-
114
-
115
-
116
-
117
-
118
-
119
-
120
-
121
-
122
-
123
-
124
-
125
-
126
-
127
-
128
-
129
-
130
-
131
-
132
-
133
-
134
-
135
-
136
-
137
-
138
-
139
-
140
-
141
-
142
-
143
-
144
-
145
-
146
-
147
-
148
-
149
-
150
-
151
-
152
-
153
-
154
-
155
-
156
-
157
-
158
-
159
-
160
-
161
-
162
-
163
-
164
-
165
-
166
-
167
-
168
-
169
-
170
-
171
-
172
-
173
-
174
-
175
-
176
-
177
-
178
-
179
-
180
-
181
-
182
-
183
-
184
-
185
-
186
-
187
-
188
-
189
-
190
-
191
-
192
-
193
-
194
-
195
-
196
-
197
-
198
-
199
-
200
-
201
-
202
-
203
-
204
-
205
-
206
-
207
-
208
-
209
-
210
-
211
-
212
-
213
-
214
-
215
-
216
-
217
-
218
-
219
-
220
-
221
-
222
-
 223
223 -
 224
224 -
 225
225 -
 226
226 -
 227
227 -
 228
228 -
 229
229 -
 230
230 -
 231
231 -
 232
232 -
 233
233 -
 234
234 -
 235
235 -
 236
236 -
 237
237 -
 238
238 -
 239
239 -
 240
240 -
 241
241 -
 242
242 -
 243
243 -
244
-
245
-
246
-
247
-
248
-
249
-
250
-
251
-
252
-
253
-
254
-
255
-
256
-
257
-
258
-
259
-
260
-
261
-
262
-
263
-
264
-
265
-
266
-
267
-
268
-
269
-
270
-
271
-
272
-
273
-
274
-
275
-
276
-
277
-
278
-
279
-
280
-
281
-
282
-
283
-
284
-
285
-
286
-
287
-
288
-
289
-
290
-
291
-
292
-
293
-
294
-
295
-
296
-
297
-
298
-
299
 |
 |

RBS Group Annual Report and Accounts 2008232
Notes on the accounts continued
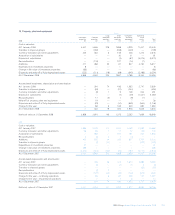
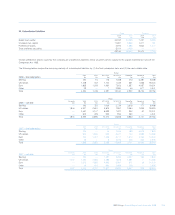
24 Insurance business (continued)
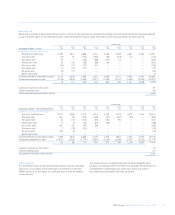
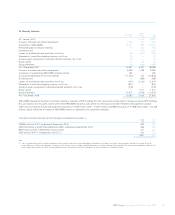
The following table shows loss ratios for each major class of business, gross and net of reinsurance.
2008 2007 2006
Earned Claims Loss Earned Loss Earned Loss
premiums incurred ratio premiums ratio premiums ratio
£m £m % £m % £m %
Residential property Gross 1,103 529 48 1,087 82 1,121 56
Net 1,034 529 51 1,020 86 1,061 59
Personal motor Gross 3,173 2,679 84 3,254 80 3,384 84
Net 3,075 2,565 83 3,161 81 3,279 85
Commercial property Gross 194 79 41 211 55 218 37
Net 174 80 46 191 60 198 38
Commercial motor Gross 143 130 91 142 75 90 69
Net 141 128 91 133 80 88 68
Other Gross 994 422 42 851 40 842 47
Net 828 426 51 839 41 833 49
Total Gross 5,607 3,839 68 5,545 73 5,655 71
Net 5,252 3,728 71 5,344 75 5,459 73
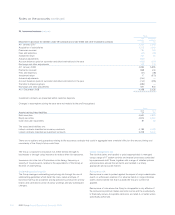
The Group has no interest rate exposure from general insurance liabilities because provisions for claims under short-term insurance contracts are
not discounted.
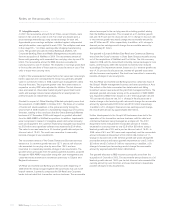
Frequency and severity of specific risks and sources of uncertainty
Most general insurance contracts are written on an annual basis, which
means that the Group’s liability extends for a 12 month period, after
which the Group is entitled to decline or renew or can impose renewal
terms by amending the premium, terms and conditions, or both.
The frequency and severity of claims and the sources of uncertainty for
the key classes that the Group is exposed to are as follows:
Motor insurance contracts (private and commercial)
Claims experience is quite variable, due to a wide range of factors, but
the principal ones are age, sex and driving experience of the driver,
type and nature of vehicle, use of vehicle and area.
There are many sources of uncertainty that will affect the Group’s
experience under motor insurance, including operational risk, reserving
risk, premium rates not matching claims inflation rates, weather, the
social, economic and legislative environment and reinsurance failure risk.
Property insurance contracts (residential and commercial)
The major causes of claims for property insurance are theft, flood, escape
of water, fire, storm, subsidence and various types of accidental damage.
The major source of uncertainty in the Group’s property accounts is the
volatility of weather. Weather in the UK can affect most of the above perils.
Over a longer period, the strength of the economy is also a factor.
Other commercial insurance contracts
Other commercial claims come mainly from business interruption and
loss arising from the negligence of the insured (liability insurance).
Business interruption losses come from the loss of income, revenue
and/or profit as a result of property damage claims. Liability insurance
includes employers liability and public/products liability. Liability
insurance is written on an occurrence basis, and is subject to claims
that are identified over a substantial period of time, but where the loss
event occurred during the life of the policy.
Fluctuations in the social and economic climate are a source of
uncertainty in the Group’s business interruption and general liability
accounts. Other sources of uncertainty are changes in the law, or its
interpretation, and reserving risk. Other uncertainties are significant
events (for example terrorist attacks) and any emerging new heads of
damage or types of claim that are not envisaged when the policy is
written.
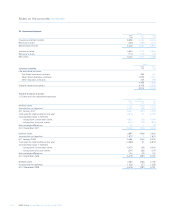
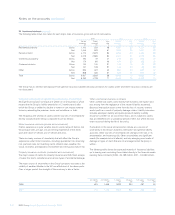
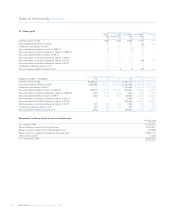
The following table shows the expected maturity of insurance liabilities
up to twenty years excluding those linked directly to the financial assets
backing these contracts (2008 – £4,189 million; 2007 – £4,398 million).
Group
0-3 months 3-12 months 1-3 years 3-5 years 5-10 years 10-20 years
£m £m £m £m £m £m
2008 623 1,645 1,899 903 487 53
2007 710 1,796 1,961 882 395 33