RBS 2008 Annual Report Download - page 232
Download and view the complete annual report
Please find page 232 of the 2008 RBS annual report below. You can navigate through the pages in the report by either clicking on the pages listed below, or by using the keyword search tool below to find specific information within the annual report.-
 1
1 -
2
-
3
-
4
-
5
-
6
-
7
-
8
-
9
-
10
-
11
-
12
-
13
-
14
-
15
-
16
-
17
-
18
-
19
-
20
-
21
-
22
-
23
-
24
-
25
-
26
-
27
-
28
-
29
-
30
-
31
-
32
-
33
-
34
-
35
-
36
-
37
-
38
-
39
-
40
-
41
-
42
-
43
-
44
-
45
-
46
-
47
-
48
-
49
-
50
-
51
-
52
-
53
-
54
-
55
-
56
-
57
-
58
-
59
-
60
-
61
-
62
-
63
-
64
-
65
-
66
-
67
-
68
-
69
-
70
-
71
-
72
-
73
-
74
-
75
-
76
-
77
-
78
-
79
-
80
-
81
-
82
-
83
-
84
-
85
-
86
-
87
-
88
-
89
-
90
-
91
-
92
-
93
-
94
-
95
-
96
-
97
-
98
-
99
-
100
-
101
-
102
-
103
-
104
-
105
-
106
-
107
-
108
-
109
-
110
-
111
-
112
-
113
-
114
-
115
-
116
-
117
-
118
-
119
-
120
-
121
-
122
-
123
-
124
-
125
-
126
-
127
-
128
-
129
-
130
-
131
-
132
-
133
-
134
-
135
-
136
-
137
-
138
-
139
-
140
-
141
-
142
-
143
-
144
-
145
-
146
-
147
-
148
-
149
-
150
-
151
-
152
-
153
-
154
-
155
-
156
-
157
-
158
-
159
-
160
-
161
-
162
-
163
-
164
-
165
-
166
-
167
-
168
-
169
-
170
-
171
-
172
-
173
-
174
-
175
-
176
-
177
-
178
-
179
-
180
-
181
-
182
-
183
-
184
-
185
-
186
-
187
-
188
-
189
-
190
-
191
-
192
-
193
-
194
-
195
-
196
-
197
-
198
-
199
-
200
-
201
-
202
-
203
-
204
-
205
-
206
-
207
-
208
-
209
-
210
-
211
-
212
-
213
-
214
-
215
-
216
-
217
-
218
-
219
-
220
-
221
-
 222
222 -
 223
223 -
 224
224 -
 225
225 -
 226
226 -
 227
227 -
 228
228 -
 229
229 -
 230
230 -
 231
231 -
 232
232 -
 233
233 -
 234
234 -
 235
235 -
 236
236 -
 237
237 -
 238
238 -
 239
239 -
 240
240 -
 241
241 -
 242
242 -
243
-
244
-
245
-
246
-
247
-
248
-
249
-
250
-
251
-
252
-
253
-
254
-
255
-
256
-
257
-
258
-
259
-
260
-
261
-
262
-
263
-
264
-
265
-
266
-
267
-
268
-
269
-
270
-
271
-
272
-
273
-
274
-
275
-
276
-
277
-
278
-
279
-
280
-
281
-
282
-
283
-
284
-
285
-
286
-
287
-
288
-
289
-
290
-
291
-
292
-
293
-
294
-
295
-
296
-
297
-
298
-
299
 |
 |

231RBS Group Annual Report and Accounts 2008
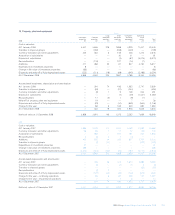
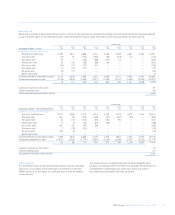
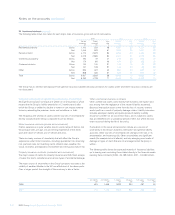
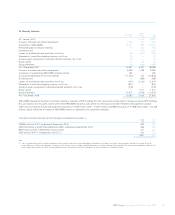
Reserving risk
Reserving risk relates to both premiums and claims. It is the risk that reserves are assessed incorrectly such that insufficient funds have been retained
to pay or handle claims as the amounts fall due. Claims development data provides information on the historical pattern of reserving risk.
Accident year
2001 2002 2003 2004 2005 2006 2007 2008 Total
Insurance claims – gross £m £m £m £m £m £m £m £m £m
Estimate of ultimate claims costs:
At end of accident year 2,395 3,013 3,658 3,710 4,265 4,269 4,621 4,080 30,011
One year later (70) 91 (140) (186) (92) (275) (71) — (743)
Two years later 20 1 (106) (88) (147) (77) ——(397)
Three years later 12 (12) (55) (85) (60) ———(200)
Four years later (40) (17) (47) (31) ————(135)
Five years later (1) (19) (21) —————(41)
Six years later (9) (11) ——————(20)
Seven years later 6——————— 6
Current estimate of cumulative claims 2,313 3,046 3,289 3,320 3,966 3,917 4,550 4,080 28,481
Cumulative payments to date (2,235) (2,932) (3,060) (2,977) (3,442) (3,121) (3,393) (2,052) (23,212)
78 114 229 343 524 796 1,157 2,028 5,269
Liability in respect of prior years 91
Claims handling costs 118
Gross general insurance claims liability 5,478
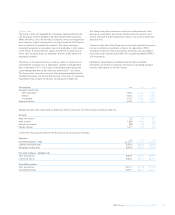
Accident year
2001 2002 2003 2004 2005 2006 2007 2008 Total
Insurance claims – net of reinsurance £m £m £m £m £m £m £m £m £m
Estimate of ultimate claims costs:
At end of accident year 2,011 2,584 3,215 3,514 4,168 4,215 4,572 4,034 28,313
One year later (61) 59 (106) (168) (67) (261) (90) — (694)
Two years later 22 (12) (103) (90) (161) (87) ——(431)
Three years later 13 (3) (53) (81) (64) ———(188)
Four years later (41) (21) (44) (46) ————(152)
Five years later 1 (24) (23) —————(46)
Six years later (19) (5) ——————(24)
Seven years later —————————
Current estimate of cumulative claims 1,926 2,578 2,886 3,129 3,876 3,867 4,482 4,034 26,778
Cumulative payments to date (1,873) (2,492) (2,714) (2,835) (3,364) (3,085) (3,347) (2,032) (21,742)
53 86 172 294 512 782 1,135 2,002 5,036
Liability in respect of prior years 42
Claims handling costs 113
Net general insurance claims liability 5,191
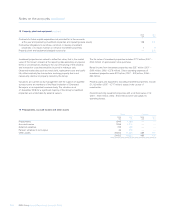
Claims reserves
It is the Group’s policy to hold undiscounted claims reserves (including
reserves to cover claims which have been incurred but not reported
(IBNR reserves)) for all classes at a sufficient level to meet all liabilities
as they fall due.
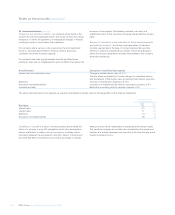
The Group’s focus is on high volume and relatively straightforward
products, for example home and motor. This facilitates the generation of
comprehensive underwriting and claims data, which are used to
accurately price and monitor the risks accepted.