RBS 2008 Annual Report Download - page 64
Download and view the complete annual report
Please find page 64 of the 2008 RBS annual report below. You can navigate through the pages in the report by either clicking on the pages listed below, or by using the keyword search tool below to find specific information within the annual report.-
 1
1 -
2
-
3
-
4
-
5
-
6
-
7
-
8
-
9
-
10
-
11
-
12
-
13
-
14
-
15
-
16
-
17
-
18
-
19
-
20
-
21
-
22
-
23
-
24
-
25
-
26
-
27
-
28
-
29
-
30
-
31
-
32
-
33
-
34
-
35
-
36
-
37
-
38
-
39
-
40
-
41
-
42
-
43
-
44
-
45
-
46
-
47
-
48
-
49
-
50
-
51
-
52
-
53
-
 54
54 -
 55
55 -
 56
56 -
 57
57 -
 58
58 -
 59
59 -
 60
60 -
 61
61 -
 62
62 -
 63
63 -
 64
64 -
 65
65 -
 66
66 -
 67
67 -
 68
68 -
 69
69 -
 70
70 -
 71
71 -
 72
72 -
 73
73 -
 74
74 -
75
-
76
-
77
-
78
-
79
-
80
-
81
-
82
-
83
-
84
-
85
-
86
-
87
-
88
-
89
-
90
-
91
-
92
-
93
-
94
-
95
-
96
-
97
-
98
-
99
-
100
-
101
-
102
-
103
-
104
-
105
-
106
-
107
-
108
-
109
-
110
-
111
-
112
-
113
-
114
-
115
-
116
-
117
-
118
-
119
-
120
-
121
-
122
-
123
-
124
-
125
-
126
-
127
-
128
-
129
-
130
-
131
-
132
-
133
-
134
-
135
-
136
-
137
-
138
-
139
-
140
-
141
-
142
-
143
-
144
-
145
-
146
-
147
-
148
-
149
-
150
-
151
-
152
-
153
-
154
-
155
-
156
-
157
-
158
-
159
-
160
-
161
-
162
-
163
-
164
-
165
-
166
-
167
-
168
-
169
-
170
-
171
-
172
-
173
-
174
-
175
-
176
-
177
-
178
-
179
-
180
-
181
-
182
-
183
-
184
-
185
-
186
-
187
-
188
-
189
-
190
-
191
-
192
-
193
-
194
-
195
-
196
-
197
-
198
-
199
-
200
-
201
-
202
-
203
-
204
-
205
-
206
-
207
-
208
-
209
-
210
-
211
-
212
-
213
-
214
-
215
-
216
-
217
-
218
-
219
-
220
-
221
-
222
-
223
-
224
-
225
-
226
-
227
-
228
-
229
-
230
-
231
-
232
-
233
-
234
-
235
-
236
-
237
-
238
-
239
-
240
-
241
-
242
-
243
-
244
-
245
-
246
-
247
-
248
-
249
-
250
-
251
-
252
-
253
-
254
-
255
-
256
-
257
-
258
-
259
-
260
-
261
-
262
-
263
-
264
-
265
-
266
-
267
-
268
-
269
-
270
-
271
-
272
-
273
-
274
-
275
-
276
-
277
-
278
-
279
-
280
-
281
-
282
-
283
-
284
-
285
-
286
-
287
-
288
-
289
-
290
-
291
-
292
-
293
-
294
-
295
-
296
-
297
-
298
-
299
 |
 |

63RBS Group Annual Report and Accounts 2008
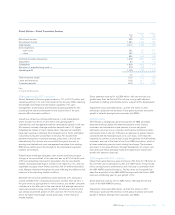
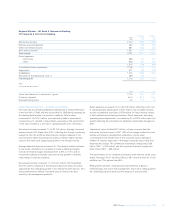
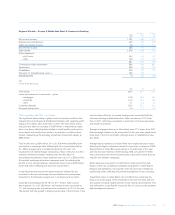
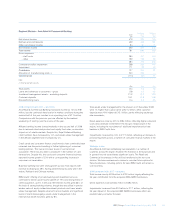
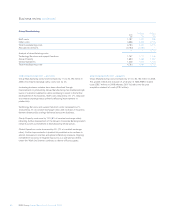
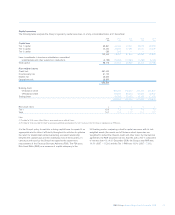
Regional Markets – Asia Retail & Commercial Banking
Pro forma Statutory
2008 2007 2007
£m £m £m
Net interest income 379 294 123
Net fees and commissions 309 338 161
Other non-interest income 93 63 71
Non-interest income 402 401 232
Total income 781 695 355
Direct expenses
– staff costs 284 237 150
– other 199 135 90
483 372 240
Contribution before impairment 298 323 115
Impairment 171 119 24
Contribution 127 204 91
Allocation of manufacturing costs (1) 240 224 —
Operating loss (113) (20) 91
Note:
(1) Only for pro forma results.
£bn £bn £bn
Total assets 8.3 7.6 7.6
Loans and advances to customers – gross 5.8 4.5 4.5
Investment management assets – excluding deposits 21.2 19.9 19.9
Customer deposits 15.1 10.8 10.8
Non-performing loans 0.3 0.5 0.5
2008 compared with 2007 – pro forma
Asia Retail & Commercial Banking increased income by 12% to £781
million, but the continued deterioration in market conditions during the
second half of the year resulted in an operating loss of £113 million.
Comparisons with the previous year are affected by the marked
weakening of sterling over the course of the year.
Affluent banking income slowed markedly in the second half of 2008
due to reduced structured product and equity fund sales, as investors
stayed out of volatile markets. Despite this, Royal Preferred Banking
client numbers have increased by 13% and assets under management
in the affluent segment have increased by 3%.
Credit cards and consumer finance credit metrics have continually been
reviewed over the period resulting in further tightening of consumer
lending policies. This has led to lower levels of card and loan
acquisition. There has also been a slowdown in the number of card
transactions. Despite this, the cards and consumer finance business
reported income growth of 20% with a corresponding increase in
consumer net receivables.
Business banking has seen strong growth across most regions with
revenue increasing by 28%, having performed particularly well in the
Indian, Pakistani and Chinese markets.
RBS Coutts’ offering of private banking and investment services
continued to deliver good income growth of 19% and strong levels of
client acquisition, up 5% in the year. Net interest income grew 56% on
the back of strong banking volumes, though this was offset in part by
weaker sales of equity-related investment products and lower assets
under management. Despite adverse financial markets and significant
levels of client deleveraging, assets under management in the
international wealth business grew by 8%.
Total assets under management for the division at 31 December 2008
were 7% higher than a year earlier at £21.2 billion, while customer
deposits were 40% higher at £15.1 billion, partly reflecting exchange
rate movements.
Direct expenses rose by 30% to £483 million, reflecting higher collection
costs and continued investment in the Group’s infrastructure in the
region, including the recruitment of additional experienced private
bankers in RBS Coutts Asia.
Impairments increased by 44% to £171 million, reflecting an increase in
provisioning levels across a number of consumer finance markets in the
region.
Strategic review
Asia Retail & Commercial Banking has operations in a number of
countries across the region. However the franchise is thinly spread and
in general has not yet achieved significant scale. The Retail and
Commercial businesses in Asia will be transferred to the non-core
division. We have commenced a review to consider future options for
these businesses, including options for sale. RBS Coutts will remain a
core business.
2008 compared with 2007 – statutory
Total income rose by £426 million to £781 million largely reflecting the
full year contribution from the acquired ABN AMRO businesses.
Direct expenses rose by £243 million to £483 million.
Impairments increased from £24 million to £171 million, reflecting the
full year impact of the acquired ABN AMRO businesses which are
predominately consumer focused.