RBS 2008 Annual Report Download - page 92
Download and view the complete annual report
Please find page 92 of the 2008 RBS annual report below. You can navigate through the pages in the report by either clicking on the pages listed below, or by using the keyword search tool below to find specific information within the annual report.-
 1
1 -
2
-
3
-
4
-
5
-
6
-
7
-
8
-
9
-
10
-
11
-
12
-
13
-
14
-
15
-
16
-
17
-
18
-
19
-
20
-
21
-
22
-
23
-
24
-
25
-
26
-
27
-
28
-
29
-
30
-
31
-
32
-
33
-
34
-
35
-
36
-
37
-
38
-
39
-
40
-
41
-
42
-
43
-
44
-
45
-
46
-
47
-
48
-
49
-
50
-
51
-
52
-
53
-
54
-
55
-
56
-
57
-
58
-
59
-
60
-
61
-
62
-
63
-
64
-
65
-
66
-
67
-
68
-
69
-
70
-
71
-
72
-
73
-
74
-
75
-
76
-
77
-
78
-
79
-
80
-
81
-
 82
82 -
 83
83 -
 84
84 -
 85
85 -
 86
86 -
 87
87 -
 88
88 -
 89
89 -
 90
90 -
 91
91 -
 92
92 -
 93
93 -
 94
94 -
 95
95 -
 96
96 -
 97
97 -
 98
98 -
 99
99 -
 100
100 -
 101
101 -
 102
102 -
103
-
104
-
105
-
106
-
107
-
108
-
109
-
110
-
111
-
112
-
113
-
114
-
115
-
116
-
117
-
118
-
119
-
120
-
121
-
122
-
123
-
124
-
125
-
126
-
127
-
128
-
129
-
130
-
131
-
132
-
133
-
134
-
135
-
136
-
137
-
138
-
139
-
140
-
141
-
142
-
143
-
144
-
145
-
146
-
147
-
148
-
149
-
150
-
151
-
152
-
153
-
154
-
155
-
156
-
157
-
158
-
159
-
160
-
161
-
162
-
163
-
164
-
165
-
166
-
167
-
168
-
169
-
170
-
171
-
172
-
173
-
174
-
175
-
176
-
177
-
178
-
179
-
180
-
181
-
182
-
183
-
184
-
185
-
186
-
187
-
188
-
189
-
190
-
191
-
192
-
193
-
194
-
195
-
196
-
197
-
198
-
199
-
200
-
201
-
202
-
203
-
204
-
205
-
206
-
207
-
208
-
209
-
210
-
211
-
212
-
213
-
214
-
215
-
216
-
217
-
218
-
219
-
220
-
221
-
222
-
223
-
224
-
225
-
226
-
227
-
228
-
229
-
230
-
231
-
232
-
233
-
234
-
235
-
236
-
237
-
238
-
239
-
240
-
241
-
242
-
243
-
244
-
245
-
246
-
247
-
248
-
249
-
250
-
251
-
252
-
253
-
254
-
255
-
256
-
257
-
258
-
259
-
260
-
261
-
262
-
263
-
264
-
265
-
266
-
267
-
268
-
269
-
270
-
271
-
272
-
273
-
274
-
275
-
276
-
277
-
278
-
279
-
280
-
281
-
282
-
283
-
284
-
285
-
286
-
287
-
288
-
289
-
290
-
291
-
292
-
293
-
294
-
295
-
296
-
297
-
298
-
299
 |
 |
91RBS Group Annual Report and Accounts 2008
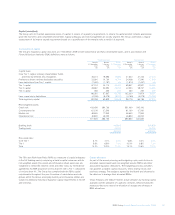
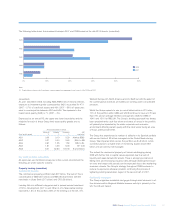
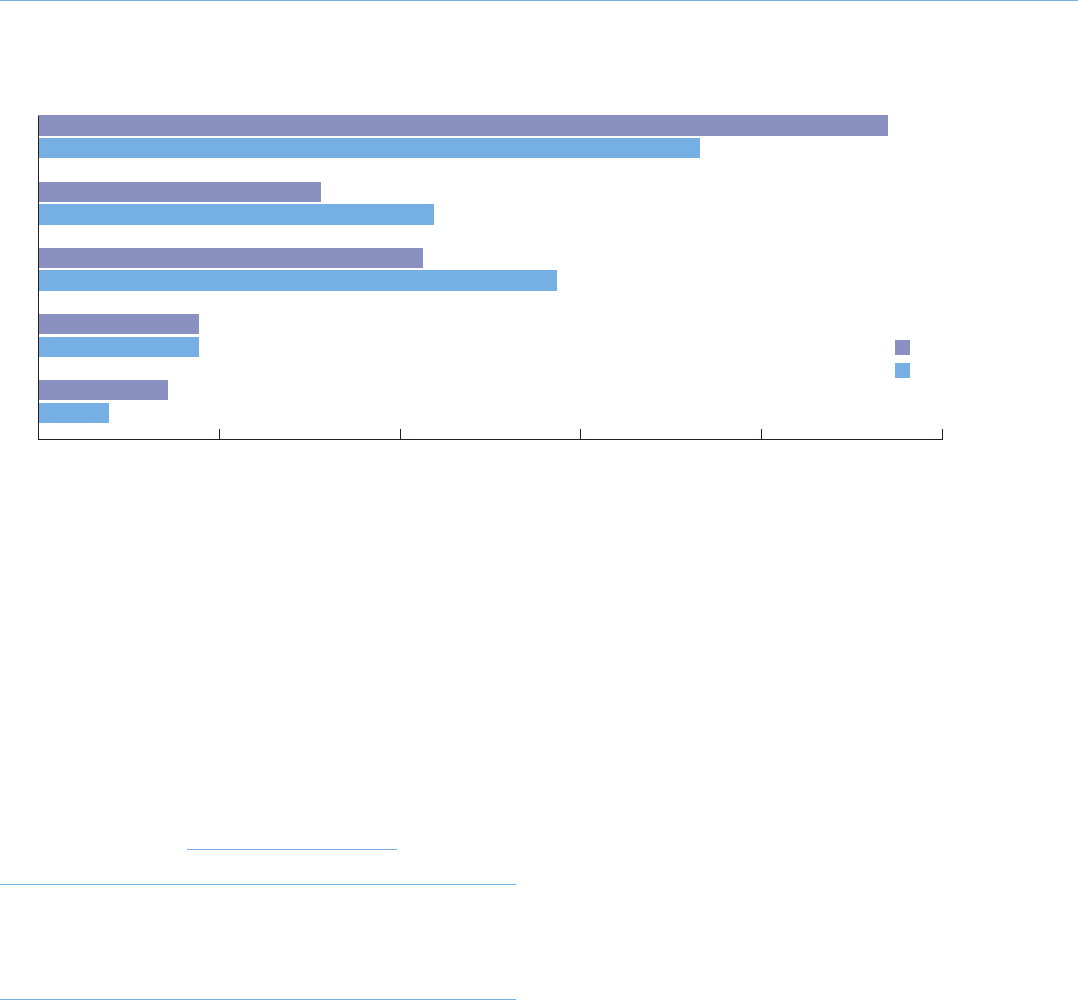
The following table shows the movement between 2007 and 2008 based on the old AQ1-5 bands. (unaudited)
AQ1
AQ2
AQ3
AQ4
AQ5
2007
2008
0% 10% 20% 30% 40% 50%
Note:
(1) Graph data are shown net of provisions, reverse repurchase agreements and issuer risk for 2008 and 2007.
(unaudited)
As at 31 December 2008, including ABN AMRO net of minority interest,
exposure to investment grade counterparties (AQ1) accounted for 47%
(2007 – 37%) of credit risk assets and 46% (2007 – 59%) of exposures
were to counterparties between AQ2 and AQ4. The exposure to the
lowest asset quality (AQ5) is 7% (2007 – 4%).
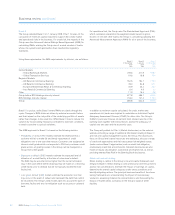
Expressed as an annual PD, the upper and lower boundaries and the
midpoint for each of these Group level asset quality grades are as
follows:
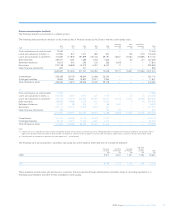
Annual probability of default
Minimum Midpoint Maximum S&P
Asset quality grade %%%equivalent
AQ1 0.00 0.10 0.20 AAA to BBB-
AQ2 0.21 0.40 0.60 BB+ to BB
AQ3 0.61 1.05 1.50 BB- to B+
AQ4 1.51 3.25 5.00 B+ to B
AQ5 5.01 52.50 100.00 B and below
Key credit portfolios (unaudited)
All exposures are monitored closely, but in the current environment the
following are under specific scrutiny:
Property lending (unaudited)
Commercial property
The commercial property portfolio totals £97 billion. The bulk of this is
concentrated in GBM (£31 billion) and RBS UK (£42 billion) with the
remainder in Ulster Bank (£17 billion) and CFG (£6 billion).
Lending falls into different categories and is spread across Investment
(72.6%), Development (24.1%) and Other (3.3%). Speculative lending
represents 1.6% of this portfolio. 58% of the lending is in the UK, 30%
Western Europe, 8% North America and 4% RoW but with the extent of
the current global downturn all markets are coming under considerable
pressure.
Whilst the Group expects to see an overall deterioration in LTV ratios,
72% of the portfolio within GBM and UKCB continue to have an LTV less
than 75% and an average interest coverage ratio (ICR) for GBM of
164% and 151% for RBS UK. The Group’s lending approach has always
been predominantly cash flow driven and areas of stress in the portfolio
will primarily be impacted by the wider corporate and economic
environment affecting tenant quality with the retail sector being an area
of focus at the present time.
The Group has experienced a number of defaults in its Spanish portfolio
with current limits of £2 billion managed via the Global Restructuring
Group. Total impaired limits across the portfolio are £3.9 billion. Limits
currently subject to a higher level of monitoring (watch) total £18.9
billion and are actively risk managed.
The outlook for commercial property will remain challenging during
2009 with further falls in capital values expected due to a lack of
liquidity and weak demand for assets. There is emerging evidence of
falling rents and increasing vacancy rates although downward pressure
on rents and longer void periods can be expected due to the weakening
economic climate. The Group’s strategy throughout 2008 has been to
reduce its exposures wherever prudent, continuing the process of
tightening lending parameters begun in the second half of 2007.
Residential mortgages
The Group originates residential mortgages through retail channels in all
four divisions within Regional Markets however activity is primarily in the
UK, the US and Ireland.