RBS 2008 Annual Report Download - page 102
Download and view the complete annual report
Please find page 102 of the 2008 RBS annual report below. You can navigate through the pages in the report by either clicking on the pages listed below, or by using the keyword search tool below to find specific information within the annual report.-
 1
1 -
2
-
3
-
4
-
5
-
6
-
7
-
8
-
9
-
10
-
11
-
12
-
13
-
14
-
15
-
16
-
17
-
18
-
19
-
20
-
21
-
22
-
23
-
24
-
25
-
26
-
27
-
28
-
29
-
30
-
31
-
32
-
33
-
34
-
35
-
36
-
37
-
38
-
39
-
40
-
41
-
42
-
43
-
44
-
45
-
46
-
47
-
48
-
49
-
50
-
51
-
52
-
53
-
54
-
55
-
56
-
57
-
58
-
59
-
60
-
61
-
62
-
63
-
64
-
65
-
66
-
67
-
68
-
69
-
70
-
71
-
72
-
73
-
74
-
75
-
76
-
77
-
78
-
79
-
80
-
81
-
82
-
83
-
84
-
85
-
86
-
87
-
88
-
89
-
90
-
91
-
 92
92 -
 93
93 -
 94
94 -
 95
95 -
 96
96 -
 97
97 -
 98
98 -
 99
99 -
 100
100 -
 101
101 -
 102
102 -
 103
103 -
 104
104 -
 105
105 -
 106
106 -
 107
107 -
 108
108 -
 109
109 -
 110
110 -
 111
111 -
 112
112 -
113
-
114
-
115
-
116
-
117
-
118
-
119
-
120
-
121
-
122
-
123
-
124
-
125
-
126
-
127
-
128
-
129
-
130
-
131
-
132
-
133
-
134
-
135
-
136
-
137
-
138
-
139
-
140
-
141
-
142
-
143
-
144
-
145
-
146
-
147
-
148
-
149
-
150
-
151
-
152
-
153
-
154
-
155
-
156
-
157
-
158
-
159
-
160
-
161
-
162
-
163
-
164
-
165
-
166
-
167
-
168
-
169
-
170
-
171
-
172
-
173
-
174
-
175
-
176
-
177
-
178
-
179
-
180
-
181
-
182
-
183
-
184
-
185
-
186
-
187
-
188
-
189
-
190
-
191
-
192
-
193
-
194
-
195
-
196
-
197
-
198
-
199
-
200
-
201
-
202
-
203
-
204
-
205
-
206
-
207
-
208
-
209
-
210
-
211
-
212
-
213
-
214
-
215
-
216
-
217
-
218
-
219
-
220
-
221
-
222
-
223
-
224
-
225
-
226
-
227
-
228
-
229
-
230
-
231
-
232
-
233
-
234
-
235
-
236
-
237
-
238
-
239
-
240
-
241
-
242
-
243
-
244
-
245
-
246
-
247
-
248
-
249
-
250
-
251
-
252
-
253
-
254
-
255
-
256
-
257
-
258
-
259
-
260
-
261
-
262
-
263
-
264
-
265
-
266
-
267
-
268
-
269
-
270
-
271
-
272
-
273
-
274
-
275
-
276
-
277
-
278
-
279
-
280
-
281
-
282
-
283
-
284
-
285
-
286
-
287
-
288
-
289
-
290
-
291
-
292
-
293
-
294
-
295
-
296
-
297
-
298
-
299
 |
 |

101RBS Group Annual Report and Accounts 2008
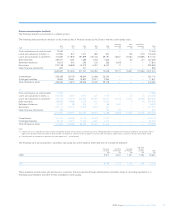
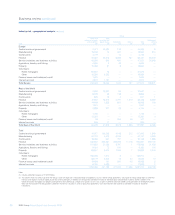
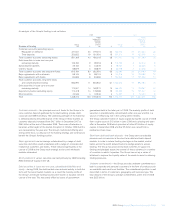
Impairment charge (audited)
The following table shows total impairment losses charged to the income statement.
2008 2007
£m £m
New impairment losses 8,391 2,310
less: recoveries of amounts previously written-off (319) (342)
Charge to income statement 8,072 1,968
Comprising:
Loan impairment losses 7,091 1,946
Impairment losses on available-for-sale securities 981 22
Charge to income statement 8,072 1,968
Impairment losses by division:
Global Markets
– Global Banking & Markets 3,643 67
– Global Transaction Services 60 14
Regional Markets
– UK Retail & Commercial Banking 1,964 1,368
– US Retail & Commercial Banking 1,041 340
– Europe & Middle East Retail & Commercial Banking 526 118
– Asia Retail & Commercial Banking 171 24
RBS Insurance 42 —
Other (15) (1)
Group before RFS Holdings minority interest 7,432 1,930
RFS Holdings minority interest 640 38
Group 8,072 1,968
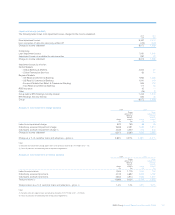
Analysis of loan impairment charge (audited)
2008 2007
Group Group
before RFS before RFS
Holdings Holdings
minority minority
Group interest Group interest
£m £m £m £m
Latent loss impairment charge 822 769 88 25
Collectively assessed impairment charge 2,606 2,391 1,584 1,813
Individually assessed impairment charge (1) 3,545 3,200 274 244
Charge to income statement 6,973 6,360 1,946 2,082
Charge as a % of customer loans and advances – gross (2) 0.82% 0.91% 0.28% 0.37%
Notes:
(1) Excludes loan impairment charge against loans and advances to banks of £118 million (2007 – nil).
(2) Gross of provisions and excluding reverse repurchase agreements.
Analysis of loan impairment provisions (audited)
2008 2007
Group Group
before RFS before RFS
Holdings Holdings
minority minority
Group interest Group interest
£m £m £m £m
Latent loss provisions 1,944 1,719 1,050 734
Collectively assessed provisions 4,102 3,692 3,845 3,162
Individually assessed provisions 4,843 3,913 1,554 1,057
Total provisions (1) 10,889 9,324 6,449 4,953
Total provision as a % of customer loans and advances – gross (2) 1.3% 1.3% 0.9% 0.9%
Notes:
(1) Excludes provisions against loans and advances to banks of £127 million (2007 – £3 million).
(2) Gross of provisions and excluding reverse repurchase agreements.