RBS 2008 Annual Report Download - page 60
Download and view the complete annual report
Please find page 60 of the 2008 RBS annual report below. You can navigate through the pages in the report by either clicking on the pages listed below, or by using the keyword search tool below to find specific information within the annual report.-
 1
1 -
2
-
3
-
4
-
5
-
6
-
7
-
8
-
9
-
10
-
11
-
12
-
13
-
14
-
15
-
16
-
17
-
18
-
19
-
20
-
21
-
22
-
23
-
24
-
25
-
26
-
27
-
28
-
29
-
30
-
31
-
32
-
33
-
34
-
35
-
36
-
37
-
38
-
39
-
40
-
41
-
42
-
43
-
44
-
45
-
46
-
47
-
48
-
49
-
 50
50 -
 51
51 -
 52
52 -
 53
53 -
 54
54 -
 55
55 -
 56
56 -
 57
57 -
 58
58 -
 59
59 -
 60
60 -
 61
61 -
 62
62 -
 63
63 -
 64
64 -
 65
65 -
 66
66 -
 67
67 -
 68
68 -
 69
69 -
 70
70 -
71
-
72
-
73
-
74
-
75
-
76
-
77
-
78
-
79
-
80
-
81
-
82
-
83
-
84
-
85
-
86
-
87
-
88
-
89
-
90
-
91
-
92
-
93
-
94
-
95
-
96
-
97
-
98
-
99
-
100
-
101
-
102
-
103
-
104
-
105
-
106
-
107
-
108
-
109
-
110
-
111
-
112
-
113
-
114
-
115
-
116
-
117
-
118
-
119
-
120
-
121
-
122
-
123
-
124
-
125
-
126
-
127
-
128
-
129
-
130
-
131
-
132
-
133
-
134
-
135
-
136
-
137
-
138
-
139
-
140
-
141
-
142
-
143
-
144
-
145
-
146
-
147
-
148
-
149
-
150
-
151
-
152
-
153
-
154
-
155
-
156
-
157
-
158
-
159
-
160
-
161
-
162
-
163
-
164
-
165
-
166
-
167
-
168
-
169
-
170
-
171
-
172
-
173
-
174
-
175
-
176
-
177
-
178
-
179
-
180
-
181
-
182
-
183
-
184
-
185
-
186
-
187
-
188
-
189
-
190
-
191
-
192
-
193
-
194
-
195
-
196
-
197
-
198
-
199
-
200
-
201
-
202
-
203
-
204
-
205
-
206
-
207
-
208
-
209
-
210
-
211
-
212
-
213
-
214
-
215
-
216
-
217
-
218
-
219
-
220
-
221
-
222
-
223
-
224
-
225
-
226
-
227
-
228
-
229
-
230
-
231
-
232
-
233
-
234
-
235
-
236
-
237
-
238
-
239
-
240
-
241
-
242
-
243
-
244
-
245
-
246
-
247
-
248
-
249
-
250
-
251
-
252
-
253
-
254
-
255
-
256
-
257
-
258
-
259
-
260
-
261
-
262
-
263
-
264
-
265
-
266
-
267
-
268
-
269
-
270
-
271
-
272
-
273
-
274
-
275
-
276
-
277
-
278
-
279
-
280
-
281
-
282
-
283
-
284
-
285
-
286
-
287
-
288
-
289
-
290
-
291
-
292
-
293
-
294
-
295
-
296
-
297
-
298
-
299
 |
 |

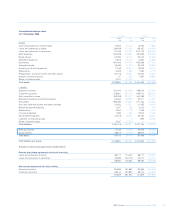
59RBS Group Annual Report and Accounts 2008
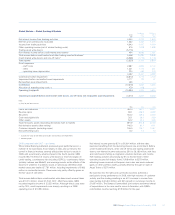
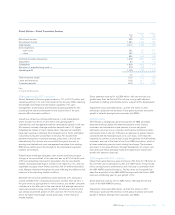
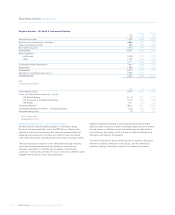
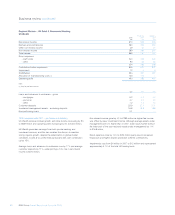
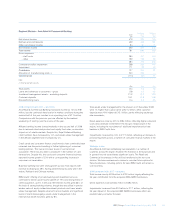
Regional Markets – US Retail & Commercial Banking
Pro forma Statutory
2008 2007 2007
£m £m £m
Net interest income 2,106 1,935 1,935
Non-interest income 904 846 846
Total income 3,010 2,781 2,781
Direct expenses
– staff costs 675 598 598
– other 411 364 364
1,086 962 962
Contribution before impairment 1,924 1,819 1,819
Impairment – core 722 177 177
Impairment – SBO 319 163 163
Contribution 883 1,479 1,479
Allocation of manufacturing costs (1) 359 336 —
Operating profit 524 1,143 1,479
Note:
(1) Only for pro forma results.
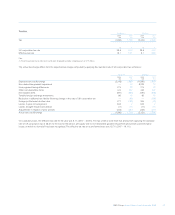
US$bn US$bn US$bn
Total assets 151.8 159.2 159.2
Loans and advances to customers – gross
– mortgages 15.7 19.1 19.1
– home equity 34.8 35.9 35.9
– other consumer 21.3 21.6 21.6
– corporate and commercial 41.2 37.6 37.6
Customer deposits 94.3 105.8 105.8
Non-performing loans 1.1 0.6 0.6
Average exchange rate – US$/£ 1.853 2.001 2.001
Spot exchange rate – US$/£ 1.460 2.004 2.004
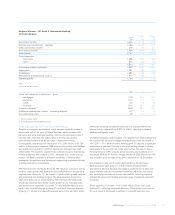
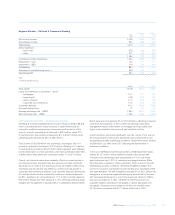
2008 compared with 2007 – pro forma and statutory
US Retail & Commercial Banking held income steady in 2008 at $5,578
million, but experienced a sharp increase in impairment losses as
economic conditions progressively worsened over the course of the
year. As a result, operating profit declined to $972 million, down 57%.
In sterling terms, total income increased by 8% to £3,010 million while
operating profit declined by 54% to £524 million.
Total income of $5,578 million was essentially unchanged, with 11%
growth in commercial banking to $1,231 million offsetting a 2% decline
in retail banking income to $4,347 million. Both segments were affected
by the deterioration in credit conditions, with retail contribution down 58%
to $926 million and commercial contribution down 7% to $711 million.
Overall, net interest income grew modestly, offset by a small decline in
non-interest income. Average loans and advances to retail customers
decreased as a result of the slowing economy and tighter underwriting
standards, but this decline was offset by continued strong growth in
corporate and commercial lending. Core customer deposits declined by
5% and the division further reduced its reliance on brokered deposits
by 80%, leading to an overall decline of 11% in total customer deposits.
Net interest margin was held steady at 2.73%, reflecting widening asset
margins and management of savings rates in a competitive deposit market.
Direct expenses increased by 5% to $2,012 million, reflecting increased
costs from the expansion of the commercial banking relationship
management teams, write-downs on mortgage servicing rights, and
higher costs related to loan work-out and collection activity.
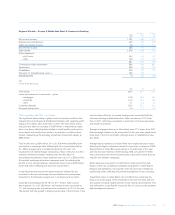
Credit conditions worsened significantly over the course of the year as
the housing market continued to deteriorate and unemployment rose,
exacerbating already challenging conditions. Impairment losses totalled
$1,929 million, up 184% from 2007 reflecting the deterioration in
economic conditions.
In the core US Retail & Commercial portfolio, 2008 impairment losses
totalled $1,337 million, with a marked increase in the second half.
Consumer non-performing loans represented 0.37% of core home
equity balances and 1.20% of residential mortgage balances. While
there has been a decline in some customers’ credit scores in line with
weakening economic conditions, refreshed weighted average FICO
scores for consumer real estate-secured lending at 31 December 2008
was approximately 740 with a weighted average LTV of 63%. Stress has
emerged in all consumer segments during the second half of the year,
with increased delinquency in core home equity (up 10bps to 0.86%),
and auto (up 94bps to 2.78%). US Retail & Commercial does not
originate negative amortization mortgages or option adjustable rate
mortgages. Closing provision balances for the core portfolio were
$1,303 million compared with $777 million at the end of 2007.