RBS 2008 Annual Report Download - page 264
Download and view the complete annual report
Please find page 264 of the 2008 RBS annual report below. You can navigate through the pages in the report by either clicking on the pages listed below, or by using the keyword search tool below to find specific information within the annual report.-
 1
1 -
2
-
3
-
4
-
5
-
6
-
7
-
8
-
9
-
10
-
11
-
12
-
13
-
14
-
15
-
16
-
17
-
18
-
19
-
20
-
21
-
22
-
23
-
24
-
25
-
26
-
27
-
28
-
29
-
30
-
31
-
32
-
33
-
34
-
35
-
36
-
37
-
38
-
39
-
40
-
41
-
42
-
43
-
44
-
45
-
46
-
47
-
48
-
49
-
50
-
51
-
52
-
53
-
54
-
55
-
56
-
57
-
58
-
59
-
60
-
61
-
62
-
63
-
64
-
65
-
66
-
67
-
68
-
69
-
70
-
71
-
72
-
73
-
74
-
75
-
76
-
77
-
78
-
79
-
80
-
81
-
82
-
83
-
84
-
85
-
86
-
87
-
88
-
89
-
90
-
91
-
92
-
93
-
94
-
95
-
96
-
97
-
98
-
99
-
100
-
101
-
102
-
103
-
104
-
105
-
106
-
107
-
108
-
109
-
110
-
111
-
112
-
113
-
114
-
115
-
116
-
117
-
118
-
119
-
120
-
121
-
122
-
123
-
124
-
125
-
126
-
127
-
128
-
129
-
130
-
131
-
132
-
133
-
134
-
135
-
136
-
137
-
138
-
139
-
140
-
141
-
142
-
143
-
144
-
145
-
146
-
147
-
148
-
149
-
150
-
151
-
152
-
153
-
154
-
155
-
156
-
157
-
158
-
159
-
160
-
161
-
162
-
163
-
164
-
165
-
166
-
167
-
168
-
169
-
170
-
171
-
172
-
173
-
174
-
175
-
176
-
177
-
178
-
179
-
180
-
181
-
182
-
183
-
184
-
185
-
186
-
187
-
188
-
189
-
190
-
191
-
192
-
193
-
194
-
195
-
196
-
197
-
198
-
199
-
200
-
201
-
202
-
203
-
204
-
205
-
206
-
207
-
208
-
209
-
210
-
211
-
212
-
213
-
214
-
215
-
216
-
217
-
218
-
219
-
220
-
221
-
222
-
223
-
224
-
225
-
226
-
227
-
228
-
229
-
230
-
231
-
232
-
233
-
234
-
235
-
236
-
237
-
238
-
239
-
240
-
241
-
242
-
243
-
244
-
245
-
246
-
247
-
248
-
249
-
250
-
251
-
252
-
253
-
 254
254 -
 255
255 -
 256
256 -
 257
257 -
 258
258 -
 259
259 -
 260
260 -
 261
261 -
 262
262 -
 263
263 -
 264
264 -
 265
265 -
 266
266 -
 267
267 -
 268
268 -
 269
269 -
 270
270 -
 271
271 -
 272
272 -
 273
273 -
 274
274 -
275
-
276
-
277
-
278
-
279
-
280
-
281
-
282
-
283
-
284
-
285
-
286
-
287
-
288
-
289
-
290
-
291
-
292
-
293
-
294
-
295
-
296
-
297
-
298
-
299
 |
 |

263RBS Group Annual Report and Accounts 2008
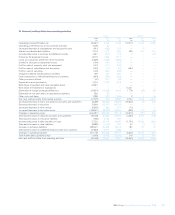
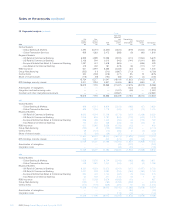
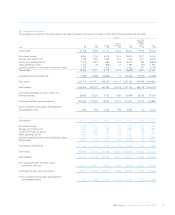
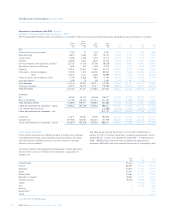
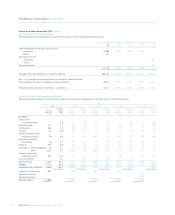
(b) Geographical segments
The geographical analyses in the tables below have been compiled on the basis of location of office where the transactions are recorded.
Group
Less: RFS
Holdings
Rest of minority
UK USA Europe the World Total interest Group
2008 £m £m £m £m £m £m £m
Total revenue 23,748 8,518 21,112 6,023 59,401 9,679 49,722
Net interest income 9,853 2,790 5,018 1,014 18,675 2,911 15,764
Net fees and commissions 3,728 1,492 1,648 577 7,445 1,011 6,434
Income from trading activities (7,103) (1,604) (552) 782 (8,477) 352 (8,829)
Other operating income 2,337 49 (528) 41 1,899 (64) 1,963
Insurance premium income (net of reinsurers’ share) 5,190 — 1,136 — 6,326 617 5,709
Total income 14,005 2,727 6,722 2,414 25,868 4,827 21,041
Operating (loss)/profit before tax (7,989) (5,809) (26,883) 14 (40,667) (15,629) (25,038)
Total assets 1,304,714 607,511 368,290 121,137 2,401,652 182,959 2,218,693
Total liabilities 1,253,814 592,272 361,590 113,478 2,321,154 166,776 2,154,378
Net assets attributable to equity owners and
minority interests 50,900 15,239 6,700 7,659 80,498 16,183 64,315
Contingent liabilities and commitments 200,763 131,435 79,941 21,122 433,261 9,272 423,989
Cost to acquire property, plant and equipment
and intangible assets 3,415 445 2,204 186 6,250 174 6,076
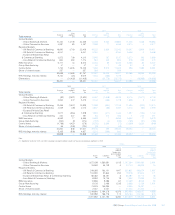
2007
Total revenue 33,743 8,570 8,140 2,578 53,031 1,678 51,353
Net interest income 8,350 2,054 1,510 155 12,069 545 11,524
Net fees and commissions 3,933 1,176 560 416 6,085 224 5,861
Income from trading activities 1,252 (486) 348 178 1,292 (139) 1,431
Other operating income 3,844 260 587 142 4,833 96 4,737
Insurance premium income (net of reinsurers’ share) 5,562 — 525 — 6,087 106 5,981
Total income 22,941 3,004 3,530 891 30,366 832 29,534
Operating profit before tax 7,761 719 1,136 216 9,832 163 9,669
Total assets 938,064 340,170 422,058 140,537 1,840,829 245,763 1,595,066
Total liabilities 902,340 326,499 392,362 128,202 1,749,403 212,766 1,536,637
Net assets attributable to equity owners
and minority interests 35,724 13,671 29,696 12,335 91,426 32,997 58,429
Contingent liabilities and commitments 197,637 95,547 82,316 24,599 400,099 21,000 379,099
Cost to acquire property, plant and equipment
and intangible assets 3,305 238 1,793 225 5,561 675 4,886