RBS 2008 Annual Report Download - page 133
Download and view the complete annual report
Please find page 133 of the 2008 RBS annual report below. You can navigate through the pages in the report by either clicking on the pages listed below, or by using the keyword search tool below to find specific information within the annual report.-
 1
1 -
2
-
3
-
4
-
5
-
6
-
7
-
8
-
9
-
10
-
11
-
12
-
13
-
14
-
15
-
16
-
17
-
18
-
19
-
20
-
21
-
22
-
23
-
24
-
25
-
26
-
27
-
28
-
29
-
30
-
31
-
32
-
33
-
34
-
35
-
36
-
37
-
38
-
39
-
40
-
41
-
42
-
43
-
44
-
45
-
46
-
47
-
48
-
49
-
50
-
51
-
52
-
53
-
54
-
55
-
56
-
57
-
58
-
59
-
60
-
61
-
62
-
63
-
64
-
65
-
66
-
67
-
68
-
69
-
70
-
71
-
72
-
73
-
74
-
75
-
76
-
77
-
78
-
79
-
80
-
81
-
82
-
83
-
84
-
85
-
86
-
87
-
88
-
89
-
90
-
91
-
92
-
93
-
94
-
95
-
96
-
97
-
98
-
99
-
100
-
101
-
102
-
103
-
104
-
105
-
106
-
107
-
108
-
109
-
110
-
111
-
112
-
113
-
114
-
115
-
116
-
117
-
118
-
119
-
120
-
121
-
122
-
 123
123 -
 124
124 -
 125
125 -
 126
126 -
 127
127 -
 128
128 -
 129
129 -
 130
130 -
 131
131 -
 132
132 -
 133
133 -
 134
134 -
 135
135 -
 136
136 -
 137
137 -
 138
138 -
 139
139 -
 140
140 -
 141
141 -
 142
142 -
 143
143 -
144
-
145
-
146
-
147
-
148
-
149
-
150
-
151
-
152
-
153
-
154
-
155
-
156
-
157
-
158
-
159
-
160
-
161
-
162
-
163
-
164
-
165
-
166
-
167
-
168
-
169
-
170
-
171
-
172
-
173
-
174
-
175
-
176
-
177
-
178
-
179
-
180
-
181
-
182
-
183
-
184
-
185
-
186
-
187
-
188
-
189
-
190
-
191
-
192
-
193
-
194
-
195
-
196
-
197
-
198
-
199
-
200
-
201
-
202
-
203
-
204
-
205
-
206
-
207
-
208
-
209
-
210
-
211
-
212
-
213
-
214
-
215
-
216
-
217
-
218
-
219
-
220
-
221
-
222
-
223
-
224
-
225
-
226
-
227
-
228
-
229
-
230
-
231
-
232
-
233
-
234
-
235
-
236
-
237
-
238
-
239
-
240
-
241
-
242
-
243
-
244
-
245
-
246
-
247
-
248
-
249
-
250
-
251
-
252
-
253
-
254
-
255
-
256
-
257
-
258
-
259
-
260
-
261
-
262
-
263
-
264
-
265
-
266
-
267
-
268
-
269
-
270
-
271
-
272
-
273
-
274
-
275
-
276
-
277
-
278
-
279
-
280
-
281
-
282
-
283
-
284
-
285
-
286
-
287
-
288
-
289
-
290
-
291
-
292
-
293
-
294
-
295
-
296
-
297
-
298
-
299
 |
 |

Business review continued
RBS Group Annual Report and Accounts 2008132
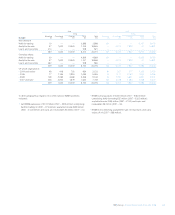
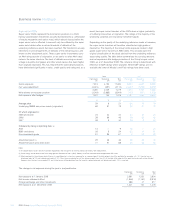
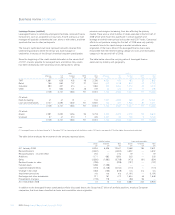
2008 2007
High grade Mezzanine Total High grade Mezzanine Total
£m £m £m £m £m £m
Gross exposure 7,673 3,720 11,393 6,420 3,040 9,460
Fair value adjustment (3,423) (691) (4,114) (3,347) (1,250) (4,597)
4,250 3,029 7,279 3,073 1,790 4,863
Write-downs on net open position (3,019) (2,885) (5,904) (492) (537) (1,029)
Net exposure after hedges 1,231 144 1,375 2,581 1,253 3,834
%%%% % %
Average price 29 6 21 84 70 79
Underlying RMBS sub-prime assets (origination) 69 91 79 69 91 79
Of which originated in:
2005 and earlier 24 23 24 24 23 24
2006 28 69 46 28 69 46
2007 48 8 30 48 8 30
Collateral by rating at reporting date: (2)
AAA 14 —936 — 23
BBB- and above 35 5 24 62 31 51
Non-investment grade 51 95 67 2 69 26
Attachment point (3) 29 46 36 29 46 35
Attachment point post write down 77 97 88 40 62 50
Notes:
(1) The above table includes data for two trades liquidated in the last quarter of 2008 to provide consistency with comparatives.
(2) Credit ratings are based on those from rating agencies Standard & Poor’s (S&P), Moody’s and Fitch and have been mapped onto S&P scale.
(3) Attachment point is the minimum level of losses in a portfolio which a tranche is exposed to, as a percentage of the total notional size of the portfolio. For example, a 5 – 10% tranche has an
attachment point of 5% and a detachment point of 10%. When the accumulated loss of the reference pool is less than 5% of the total initial notional of the pool, the tranche will not be affected.
However, when the loss has exceeded 5%, any further losses will be deducted from the tranche’s notional principal until detachment point, 10%, is reached.
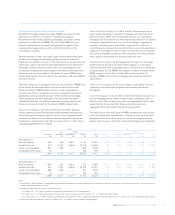
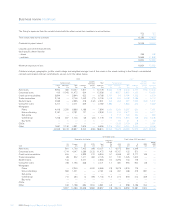
Super senior CDOs
Super senior CDOs represent the most senior positions in a CDO,
having subordination instruments (usually represented by a combination
of equity, mezzanine and senior notes) which absorb losses before the
super senior note is affected. Losses will only be suffered by the super
senior note holders after a certain threshold of defaults of the
underlying reference assets has been reached. The threshold is usually
referred to in percentage terms of defaults of the remaining pool, and
known as the ‘attachment point’. These super senior instruments carry
an AAA rating at point of origination, or are senior to other AAA rated
notes in the same structure. The level of defaults occurring on recent
vintage sub-prime mortgages and other asset classes has been higher
than originally expected. This has meant that the subordinate positions
have diminished significantly in value, credit quality and rating and, as a
result, the super senior tranches of the CDOs have a higher probability
of suffering losses than at origination. The ratings of the majority of the
underlying collateral are now below investment grade.
Depending on the quality of the underlying reference assets at issuance,
the super senior tranches will be either classified as high grade or
mezzanine. The majority of the Group’s total exposure relates to high
grade super senior tranches of ABS CDOs. This is based upon the
original classification of the deals derived from the underlying reference
asset rating quality. The table below summarises the carrying amounts
and net exposures after hedge protection of the Group’s super senior
CDOs as at 31 December 2008. The collateral rating is determined with
reference to S&P ratings where available. Where S&P ratings are not
available the lower of Moody’s and Fitch ratings have been used.
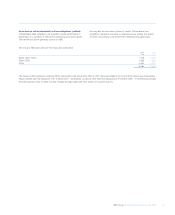
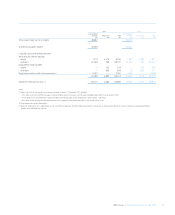
The change in net exposure during the year is analysed below.
High grade Mezzanine Total
£m £m £m
Net exposure at 1 January 2008 2,581 1,253 3,834
Net income statement effect (1,836) (1,140) (2,976)
Foreign exchange and other movements 486 31 517
Net exposure at 31 December 2008 1,231 144 1,375