RBS 2008 Annual Report Download - page 82
Download and view the complete annual report
Please find page 82 of the 2008 RBS annual report below. You can navigate through the pages in the report by either clicking on the pages listed below, or by using the keyword search tool below to find specific information within the annual report.-
 1
1 -
2
-
3
-
4
-
5
-
6
-
7
-
8
-
9
-
10
-
11
-
12
-
13
-
14
-
15
-
16
-
17
-
18
-
19
-
20
-
21
-
22
-
23
-
24
-
25
-
26
-
27
-
28
-
29
-
30
-
31
-
32
-
33
-
34
-
35
-
36
-
37
-
38
-
39
-
40
-
41
-
42
-
43
-
44
-
45
-
46
-
47
-
48
-
49
-
50
-
51
-
52
-
53
-
54
-
55
-
56
-
57
-
58
-
59
-
60
-
61
-
62
-
63
-
64
-
65
-
66
-
67
-
68
-
69
-
70
-
71
-
 72
72 -
 73
73 -
 74
74 -
 75
75 -
 76
76 -
 77
77 -
 78
78 -
 79
79 -
 80
80 -
 81
81 -
 82
82 -
 83
83 -
 84
84 -
 85
85 -
 86
86 -
 87
87 -
 88
88 -
 89
89 -
 90
90 -
 91
91 -
 92
92 -
93
-
94
-
95
-
96
-
97
-
98
-
99
-
100
-
101
-
102
-
103
-
104
-
105
-
106
-
107
-
108
-
109
-
110
-
111
-
112
-
113
-
114
-
115
-
116
-
117
-
118
-
119
-
120
-
121
-
122
-
123
-
124
-
125
-
126
-
127
-
128
-
129
-
130
-
131
-
132
-
133
-
134
-
135
-
136
-
137
-
138
-
139
-
140
-
141
-
142
-
143
-
144
-
145
-
146
-
147
-
148
-
149
-
150
-
151
-
152
-
153
-
154
-
155
-
156
-
157
-
158
-
159
-
160
-
161
-
162
-
163
-
164
-
165
-
166
-
167
-
168
-
169
-
170
-
171
-
172
-
173
-
174
-
175
-
176
-
177
-
178
-
179
-
180
-
181
-
182
-
183
-
184
-
185
-
186
-
187
-
188
-
189
-
190
-
191
-
192
-
193
-
194
-
195
-
196
-
197
-
198
-
199
-
200
-
201
-
202
-
203
-
204
-
205
-
206
-
207
-
208
-
209
-
210
-
211
-
212
-
213
-
214
-
215
-
216
-
217
-
218
-
219
-
220
-
221
-
222
-
223
-
224
-
225
-
226
-
227
-
228
-
229
-
230
-
231
-
232
-
233
-
234
-
235
-
236
-
237
-
238
-
239
-
240
-
241
-
242
-
243
-
244
-
245
-
246
-
247
-
248
-
249
-
250
-
251
-
252
-
253
-
254
-
255
-
256
-
257
-
258
-
259
-
260
-
261
-
262
-
263
-
264
-
265
-
266
-
267
-
268
-
269
-
270
-
271
-
272
-
273
-
274
-
275
-
276
-
277
-
278
-
279
-
280
-
281
-
282
-
283
-
284
-
285
-
286
-
287
-
288
-
289
-
290
-
291
-
292
-
293
-
294
-
295
-
296
-
297
-
298
-
299
 |
 |

81RBS Group Annual Report and Accounts 2008
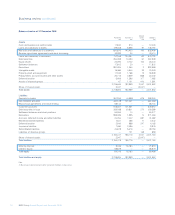
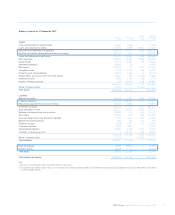
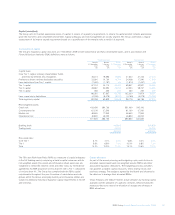
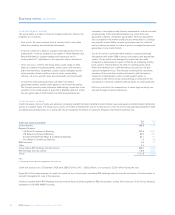
Composition of capital
The Group’s regulatory capital resources at 31 December 2008 on both proportional and fully consolidated bases, and in accordance with
Financial Services Authority (FSA) definitions were as follows:
Proportional basis Statutory basis
Basel II Basel II Basel I Basel II Basel II Basel I
31 December 1 January 31 December 31 December 1 January 31 December
2008 2008 2007 2008 2008 2007
£m £m £m £m £m £m
Capital base:
Core Tier 1 capital: ordinary shareholders’ funds
and minority interests less intangibles 35,473 19,596 19,596 47,623 27,324 27,324
Preference shares and tax deductible securities 23,091 14,704 14,704 24,038 17,040 17,040
Less deductions from Tier 1 capital (1,440) (1,187) n/a (1,814) (1,457) n/a
Tier 1 capital 57,124 33,113 34,300 69,847 42,907 44,364
Tier 2 capital 28,967 24,594 29,250 32,223 28,767 33,693
Tier 3 capital 260 200 200 260 200 200
86,351 57,907 63,750 102,330 71,874 78,257
Less: supervisory deductions (4,155) (5,078) (8,202) (4,155) (5,078) (10,283)
Total regulatory capital 82,196 52,829 55,548 98,175 66,796 67,974
Risk-weighted assets:
Credit risk 433,400 394,700 551,400 542,100
Counterparty risk 61,100 37,500 61,100 37,500
Market risk 46,500 17,900 46,500 17,900
Operational risk 36,800 36,000 36,800 36,000
577,800 486,100 695,800 633,500
Banking book 445,800 564,800
Trading book 44,200 44,200
490,000 609,000
Risk asset ratio:
Core Tier 1 6.1% 4.0% 4.0% 6.8% 4.3% 4.5%
Tier 1 9.9% 6.8% 7.0% 10.0% 6.8% 7.3%
Total 14.2% 10.9% 11.3% 14.1% 10.5% 11.2%
Capital (unaudited)
The Group aims to maintain appropriate levels of capital, in excess of regulatory requirements, to ensure its capital position remains appropriate
given the economic and competitive environment. Capital adequacy and risk management are closely aligned. The Group undertakes a regular
assessment of its internal capital requirement based on a quantification of the material risks to which it is exposed.
The FSA uses Risk Asset Ratio (RAR) as a measure of capital adequacy
in the UK banking sector, comparing a bank’s capital resources with its
risk-weighted assets (the assets and off-balance sheet exposures are
‘weighted’ to reflect the inherent credit and other risks); by international
agreement, the RAR should be not less than 8% with a Tier 1 component
of not less than 4%. The Group has complied with the FSA’s capital
requirements throughout the year. A number of subsidiaries and sub-
groups within the Group, principally banking and insurance entities are
subject to additional individual regulatory capital requirements in the UK
and overseas.
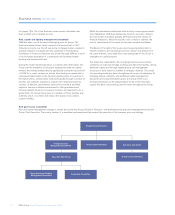
Capital allocation
As part of the annual planning and budgeting cycle, each division is
allocated capital based upon risk-weighted assets (RWAs) and their
associated regulatory deductions. The budgeting process considers
risk appetite, available capital resources, stress testing results and
business strategy. The budget is agreed by the Board and allocated to
the divisions to manage their allocated RWAs.
Group Treasury and GALCO monitor actual utilisation by tracking capital
available and the utilisation of capital by divisions. GALCO makes the
necessary decisions around re-allocation of budget and changes in
RWA allocations.