RBS 2008 Annual Report Download - page 58
Download and view the complete annual report
Please find page 58 of the 2008 RBS annual report below. You can navigate through the pages in the report by either clicking on the pages listed below, or by using the keyword search tool below to find specific information within the annual report.-
 1
1 -
2
-
3
-
4
-
5
-
6
-
7
-
8
-
9
-
10
-
11
-
12
-
13
-
14
-
15
-
16
-
17
-
18
-
19
-
20
-
21
-
22
-
23
-
24
-
25
-
26
-
27
-
28
-
29
-
30
-
31
-
32
-
33
-
34
-
35
-
36
-
37
-
38
-
39
-
40
-
41
-
42
-
43
-
44
-
45
-
46
-
47
-
 48
48 -
 49
49 -
 50
50 -
 51
51 -
 52
52 -
 53
53 -
 54
54 -
 55
55 -
 56
56 -
 57
57 -
 58
58 -
 59
59 -
 60
60 -
 61
61 -
 62
62 -
 63
63 -
 64
64 -
 65
65 -
 66
66 -
 67
67 -
 68
68 -
69
-
70
-
71
-
72
-
73
-
74
-
75
-
76
-
77
-
78
-
79
-
80
-
81
-
82
-
83
-
84
-
85
-
86
-
87
-
88
-
89
-
90
-
91
-
92
-
93
-
94
-
95
-
96
-
97
-
98
-
99
-
100
-
101
-
102
-
103
-
104
-
105
-
106
-
107
-
108
-
109
-
110
-
111
-
112
-
113
-
114
-
115
-
116
-
117
-
118
-
119
-
120
-
121
-
122
-
123
-
124
-
125
-
126
-
127
-
128
-
129
-
130
-
131
-
132
-
133
-
134
-
135
-
136
-
137
-
138
-
139
-
140
-
141
-
142
-
143
-
144
-
145
-
146
-
147
-
148
-
149
-
150
-
151
-
152
-
153
-
154
-
155
-
156
-
157
-
158
-
159
-
160
-
161
-
162
-
163
-
164
-
165
-
166
-
167
-
168
-
169
-
170
-
171
-
172
-
173
-
174
-
175
-
176
-
177
-
178
-
179
-
180
-
181
-
182
-
183
-
184
-
185
-
186
-
187
-
188
-
189
-
190
-
191
-
192
-
193
-
194
-
195
-
196
-
197
-
198
-
199
-
200
-
201
-
202
-
203
-
204
-
205
-
206
-
207
-
208
-
209
-
210
-
211
-
212
-
213
-
214
-
215
-
216
-
217
-
218
-
219
-
220
-
221
-
222
-
223
-
224
-
225
-
226
-
227
-
228
-
229
-
230
-
231
-
232
-
233
-
234
-
235
-
236
-
237
-
238
-
239
-
240
-
241
-
242
-
243
-
244
-
245
-
246
-
247
-
248
-
249
-
250
-
251
-
252
-
253
-
254
-
255
-
256
-
257
-
258
-
259
-
260
-
261
-
262
-
263
-
264
-
265
-
266
-
267
-
268
-
269
-
270
-
271
-
272
-
273
-
274
-
275
-
276
-
277
-
278
-
279
-
280
-
281
-
282
-
283
-
284
-
285
-
286
-
287
-
288
-
289
-
290
-
291
-
292
-
293
-
294
-
295
-
296
-
297
-
298
-
299
 |
 |

57RBS Group Annual Report and Accounts 2008
2008 compared with 2007 – pro forma and statutory
UK Corporate & Commercial Banking experienced a solid performance
in the first half of 2008, with the second half of 2008 being impacted by
the marked deterioration in economic conditions. Total income
increased 5% to £3,161 million and contribution before impairments
increased by 2%. Growth in impairments, especially in the second half
of the year, resulted in a 30% fall in operating profit to £1,116 million.
Net interest income increased 7% to £2,130 million. Average loans and
advances were 18% higher than 2007, reflecting the Group’s continuing
support for the UK economy. New business margins widened in the
second half to reflect increasing risk premia, however, higher funding
costs on the back book suppressed growth in net interest income.
Average deposit balances increased 3%. The deposit market continues
to see acute competition in a number of sectors affecting margins.
Overall net interest margin decreased from 2.39% to 2.15% due to
increased funding and liquidity costs and strong growth in relatively
lower margin Corporate products.
Non interest income increased 1% to £1,031 million. 2007 benefited
from the profit on disposal of the Securities Services Group business;
adjusting for this underlying growth in non interest income was 6%. This
strong performance reflects increased sales of interest rate and
currency risk management products.
Direct expenses increased 13% to £1,015 million, reflecting a 26% rise
in operating lease depreciation to £401 million, due to higher volumes
as well as additional provisions of £54 million for lower residual values
in the Lombard vehicle leasing business. Direct expenses, excluding
operating lease depreciation, increased by 6% to £614 million with cost
growth reflecting the recruitment of additional relationship managers in
2007.
Impairment losses totalled £671 million, a sharp increase from the
historically low levels seen in 2007. 48% of the charge related to house
builder and property development companies. Losses were
concentrated in the smaller end of the corporate sector, although a
number of specific exposures in the larger corporate sector have also
impacted the charge. The commercial businesses charge was £368
million (2007 – £100 million) and the corporate business charge was
£303 million (2007 – £80 million).
The performance of our commercial property book remains under close
watch. Average LTVs in the UK portfolio is 68% and less than 5% of the
portfolio has LTVs greater than 85%.
RWA growth has been constrained by improvements in Basel II
methodologies and active risk management, which have offset growth in
the underlying balance sheet and the impacts of procyclicality.
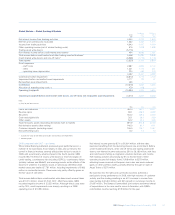
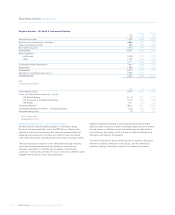
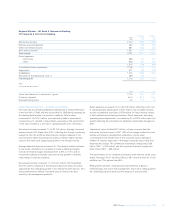
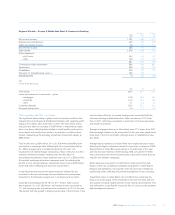
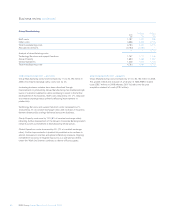
Regional Markets – UK Retail & Commercial Banking
UK Corporate & Commercial Banking
Pro forma Statutory
2008 2007 2007
£m £m £m
Net interest income 2,130 1,990 1,990
Net fees and commissions 450 425 425
Other non-interest income 581 592 592
Non–interest income 1,031 1,017 1,017
Total income 3,161 3,007 3,007
Direct expenses
– staff costs 486 431 431
– other 529 467 467
1,015 898 898
Contribution before impairment 2,146 2,109 2,109
Impairment 671 180 180
Contribution 1,475 1,929 1,929
Allocation of manufacturing costs (1) 359 336 —
Operating profit 1,116 1,593 1,929
Note:
(1) Only for pro forma results.
£bn £bn £bn
Loans and advances to customers – gross 110.4 99.3 99.3
Customer deposits 64.3 66.2 66.2
Non-performing loans 3.0 1.2 1.2