RBS 2008 Annual Report Download - page 88
Download and view the complete annual report
Please find page 88 of the 2008 RBS annual report below. You can navigate through the pages in the report by either clicking on the pages listed below, or by using the keyword search tool below to find specific information within the annual report.-
 1
1 -
2
-
3
-
4
-
5
-
6
-
7
-
8
-
9
-
10
-
11
-
12
-
13
-
14
-
15
-
16
-
17
-
18
-
19
-
20
-
21
-
22
-
23
-
24
-
25
-
26
-
27
-
28
-
29
-
30
-
31
-
32
-
33
-
34
-
35
-
36
-
37
-
38
-
39
-
40
-
41
-
42
-
43
-
44
-
45
-
46
-
47
-
48
-
49
-
50
-
51
-
52
-
53
-
54
-
55
-
56
-
57
-
58
-
59
-
60
-
61
-
62
-
63
-
64
-
65
-
66
-
67
-
68
-
69
-
70
-
71
-
72
-
73
-
74
-
75
-
76
-
77
-
 78
78 -
 79
79 -
 80
80 -
 81
81 -
 82
82 -
 83
83 -
 84
84 -
 85
85 -
 86
86 -
 87
87 -
 88
88 -
 89
89 -
 90
90 -
 91
91 -
 92
92 -
 93
93 -
 94
94 -
 95
95 -
 96
96 -
 97
97 -
 98
98 -
99
-
100
-
101
-
102
-
103
-
104
-
105
-
106
-
107
-
108
-
109
-
110
-
111
-
112
-
113
-
114
-
115
-
116
-
117
-
118
-
119
-
120
-
121
-
122
-
123
-
124
-
125
-
126
-
127
-
128
-
129
-
130
-
131
-
132
-
133
-
134
-
135
-
136
-
137
-
138
-
139
-
140
-
141
-
142
-
143
-
144
-
145
-
146
-
147
-
148
-
149
-
150
-
151
-
152
-
153
-
154
-
155
-
156
-
157
-
158
-
159
-
160
-
161
-
162
-
163
-
164
-
165
-
166
-
167
-
168
-
169
-
170
-
171
-
172
-
173
-
174
-
175
-
176
-
177
-
178
-
179
-
180
-
181
-
182
-
183
-
184
-
185
-
186
-
187
-
188
-
189
-
190
-
191
-
192
-
193
-
194
-
195
-
196
-
197
-
198
-
199
-
200
-
201
-
202
-
203
-
204
-
205
-
206
-
207
-
208
-
209
-
210
-
211
-
212
-
213
-
214
-
215
-
216
-
217
-
218
-
219
-
220
-
221
-
222
-
223
-
224
-
225
-
226
-
227
-
228
-
229
-
230
-
231
-
232
-
233
-
234
-
235
-
236
-
237
-
238
-
239
-
240
-
241
-
242
-
243
-
244
-
245
-
246
-
247
-
248
-
249
-
250
-
251
-
252
-
253
-
254
-
255
-
256
-
257
-
258
-
259
-
260
-
261
-
262
-
263
-
264
-
265
-
266
-
267
-
268
-
269
-
270
-
271
-
272
-
273
-
274
-
275
-
276
-
277
-
278
-
279
-
280
-
281
-
282
-
283
-
284
-
285
-
286
-
287
-
288
-
289
-
290
-
291
-
292
-
293
-
294
-
295
-
296
-
297
-
298
-
299
 |
 |

87RBS Group Annual Report and Accounts 2008
Credit concentration risk (including country risk) (audited)
The Group defines three key areas of concentration in credit risk that
are monitored, reported and managed at Group and divisional levels.
These are single name concentration, industry/sector and country risk.
The Group has a series of quantitative and qualitative controls in place
to limit the amount of concentration risk in credit portfolios.
A threshold is set on the aggregate LGD to a single customer group
above which approval is required from the Group’s most senior credit
committee, the Advances Committee.
During the year work progressed on an enhancement of the frameworks
for managing single name and sector concentrations. These
enhancements are planned to be fully implemented in 2009 to improve
the identification and management of concentrations in the portfolio
through the introduction of additional parameters and increased
scrutiny of concentration limit excesses.
A stress testing framework, Correlated Exposure Loss Testing, assesses
the impact on the Group’s impairment charge of non-systemic events
that affect groups of inter-related sectors in order to limit the impact of
these scenarios to within defined tolerances.
Country risk arises from sovereign events (e.g. default or restructuring);
economic events (e.g. contagion of sovereign default to other parts of
the economy, cyclical economic shock); political events (e.g.
convertibility restrictions and expropriation or nationalisation) and natural
disaster or conflict. Losses are broadly defined and include credit,
market, liquidity, operational and franchise risk related losses. The
acquisition of ABN AMRO materially increased the Group's country risk
profile, therefore significant enhancements to the Group’s country risk
framework have been implemented and continue to be developed.
It is the Group’s policy to monitor and control country risk exposures
and to avoid excessive concentrations. The Group’s appetite is
expressed by a matrix of limits by country risk grade and is approved
by GEMC. The Group’s exposure is managed and measured within this
appetite by the Group Country Risk Management Committee (GCRMC),
that has delegated authority from the GRC to manage country risk and
agree related policy. Membership of GCRMC comprises the Group
Chief Credit Officer, Heads of Credit and business representatives from
those divisions with material country risk exposures. GCRMC sets limits
for each country based on a risk assessment taking into account the
Group’s franchise and business mix in that country. Additional limitations
– on product types with higher loss potential and longer tenor
transactions, for example – may be established depending on the
country outlook and business strategy. A country watch list framework is
in place to proactively monitor emerging issues and facilitates the
development of mitigation strategies.
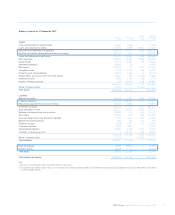
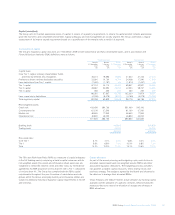
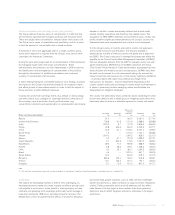
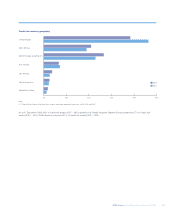
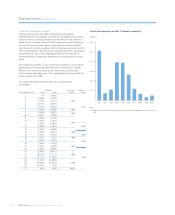
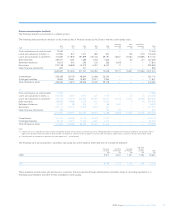
The country risk table below shows credit risk assets exceeding £1 billion
by borrower domicile and is stated gross of mitigating action which may
have been taken to reduce or eliminate exposure to country risk events.
Banks and
financial
Consumer Sovereign institutions Corporate Total
Risk countries (unaudited) £m £m £m £m £m
Russia 51.0 — 362.0 5,361.0 5,774.0
United Arab Emirates 756.8 91.5 1,721.9 2,988.6 5,558.8
India 1,020.0 5.7 737.9 3,800.6 5,564.2
Turkey 24.8 363.6 603.2 3,035.5 4,027.1
China 24.6 61.1 1,146.3 2,027.2 3,259.2
South Korea 1.5 — 1,743.0 1,104.1 2,848.6
Taiwan 1,019.3 — 1,393.2 825.0 3,237.5
Mexico 4.2 57.1 210.9 1,999.9 2,272.1
Czech Republic 2.1 593.5 175.5 1,057.9 1,829.0
Kazakhstan 69.5 17.0 900.8 858.9 1,846.2
Poland 6.8 38.5 309.1 1,308.6 1,663.0
Chile 0.3 26.1 383.7 1,250.5 1,660.6
Brazil 3.6 — 1,012.3 641.7 1,657.6
Saudi Arabia 23.2 — 534.9 679.4 1,237.5
Romania 583.6 145.3 160.4 916.8 1,806.1
Greece 15.1 135.3 210.3 702.7 1,063.4
Hungary 5.1 73.9 101.3 831.4 1,011.7
Note:
(1) Risk countries are defined as those with an internal rating of A+ and below. In addition, United Arab Emirates is included which has a rating of AA.
(unaudited)
The outlook for developing markets in 2009 is very challenging, as
developed economy demand is weak, liquidity conditions are tight and
risk appetite is yet to return. Asian growth is slowing sharply as trade
contracts, but generally, both sovereign and private sector leverage is
lower than during the 1998 crisis, providing scope for recovery. The
Middle East is more insulated from the effects of economic disruption
but certain high growth countries, such as UAE, will face challenges.
Eastern Europe faces a deep correction as large economic imbalances
unwind. Falling commodity prices and US weakness will also affect
Latin America, but the region is more resilient than during previous
downturns due to reform progress and policy orthodoxy in its largest
economies.