RBS 2008 Annual Report Download - page 103
Download and view the complete annual report
Please find page 103 of the 2008 RBS annual report below. You can navigate through the pages in the report by either clicking on the pages listed below, or by using the keyword search tool below to find specific information within the annual report.-
 1
1 -
2
-
3
-
4
-
5
-
6
-
7
-
8
-
9
-
10
-
11
-
12
-
13
-
14
-
15
-
16
-
17
-
18
-
19
-
20
-
21
-
22
-
23
-
24
-
25
-
26
-
27
-
28
-
29
-
30
-
31
-
32
-
33
-
34
-
35
-
36
-
37
-
38
-
39
-
40
-
41
-
42
-
43
-
44
-
45
-
46
-
47
-
48
-
49
-
50
-
51
-
52
-
53
-
54
-
55
-
56
-
57
-
58
-
59
-
60
-
61
-
62
-
63
-
64
-
65
-
66
-
67
-
68
-
69
-
70
-
71
-
72
-
73
-
74
-
75
-
76
-
77
-
78
-
79
-
80
-
81
-
82
-
83
-
84
-
85
-
86
-
87
-
88
-
89
-
90
-
91
-
92
-
 93
93 -
 94
94 -
 95
95 -
 96
96 -
 97
97 -
 98
98 -
 99
99 -
 100
100 -
 101
101 -
 102
102 -
 103
103 -
 104
104 -
 105
105 -
 106
106 -
 107
107 -
 108
108 -
 109
109 -
 110
110 -
 111
111 -
 112
112 -
 113
113 -
114
-
115
-
116
-
117
-
118
-
119
-
120
-
121
-
122
-
123
-
124
-
125
-
126
-
127
-
128
-
129
-
130
-
131
-
132
-
133
-
134
-
135
-
136
-
137
-
138
-
139
-
140
-
141
-
142
-
143
-
144
-
145
-
146
-
147
-
148
-
149
-
150
-
151
-
152
-
153
-
154
-
155
-
156
-
157
-
158
-
159
-
160
-
161
-
162
-
163
-
164
-
165
-
166
-
167
-
168
-
169
-
170
-
171
-
172
-
173
-
174
-
175
-
176
-
177
-
178
-
179
-
180
-
181
-
182
-
183
-
184
-
185
-
186
-
187
-
188
-
189
-
190
-
191
-
192
-
193
-
194
-
195
-
196
-
197
-
198
-
199
-
200
-
201
-
202
-
203
-
204
-
205
-
206
-
207
-
208
-
209
-
210
-
211
-
212
-
213
-
214
-
215
-
216
-
217
-
218
-
219
-
220
-
221
-
222
-
223
-
224
-
225
-
226
-
227
-
228
-
229
-
230
-
231
-
232
-
233
-
234
-
235
-
236
-
237
-
238
-
239
-
240
-
241
-
242
-
243
-
244
-
245
-
246
-
247
-
248
-
249
-
250
-
251
-
252
-
253
-
254
-
255
-
256
-
257
-
258
-
259
-
260
-
261
-
262
-
263
-
264
-
265
-
266
-
267
-
268
-
269
-
270
-
271
-
272
-
273
-
274
-
275
-
276
-
277
-
278
-
279
-
280
-
281
-
282
-
283
-
284
-
285
-
286
-
287
-
288
-
289
-
290
-
291
-
292
-
293
-
294
-
295
-
296
-
297
-
298
-
299
 |
 |

102
Business review continued
RBS Group Annual Report and Accounts 2008
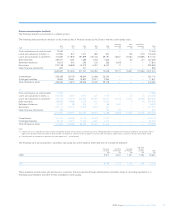
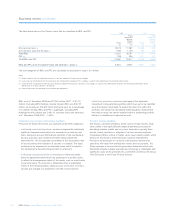
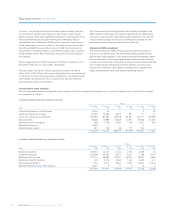
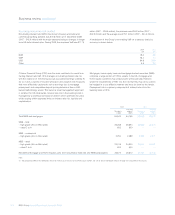
Provisions coverage (audited)
The Group’s provision coverage ratios are shown in the table below.
2008 2007
Group Group
before RFS before RFS
Holdings Holdings
minority minority
Group interest Group interest
£m £m £m £m
Total provision expressed as a:
% of REIL 52% 50% 60% 60%
% of REIL and PPL 51% 50% 57% 59%
The coverage ratio of closing provisions to REIL and PPL decreased from 57% to 51% during 2008. Excluding RFS Holdings minority interest, the
coverage ratio was 50%. The lower coverage ratio reflects amounts written-off and the changing mix from unsecured to secured exposures.
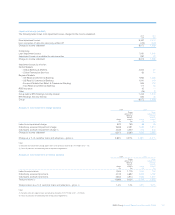
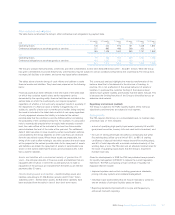
Movement in loan impairment provisions (audited)
The following table shows the movement in the provision for impairment losses for loans and advances.
Group before RFS Holdings minority interest Group
Individually Collectively Total Individually Collectively Total
assessed assessed Latent 2008 2007 assessed assessed Latent 2008 2007
£m £m £m £m £m £m £m £m £m £m
At 1 January 1,119 3,098 739 4,956 4,501 1,568 3,834 1,050 6,452 3,935
Transfer to disposal groups —————(222) (351) (194) (767) —
Currency translation and
other adjustments 600 182 241 1,023 56 1,065 81 295 1,441 137
Acquisition of subsidiaries ————129 ————2,221
Disposal of subsidiaries — (148) (30) (178) —— (149) (29) (178) —
Net increase in provisions of
discontinued operations —————————46
Amounts written-off (1,014) (1,883) — (2,897) (1,914) (1,165) (1,983) — (3,148) (2,011)
Recoveries of amounts
previously written-off 68 193 — 261 275 113 206 — 319 342
Charged to the income statement 3,318 2,391 769 6,478 2,082 3,663 2,606 822 7,091 1,946
Unwind of discount (51) (141) — (192) (173) (52) (142) — (194) (164)
At 31 December (1) 4,040 3,692 1,719 9,451 4,956 4,970 4,102 1,944 11,016 6,452
Note:
(1) The provision for impairment losses at 31 December 2008 include £127 million relating to loans and advances to banks (2007 – £3 million).
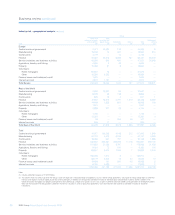
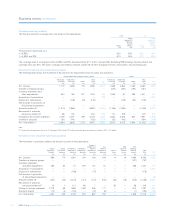
Movement in loan impairment provisions (audited)
The movement in provisions balance by division is shown in the table below.
Europe &
Middle East Asia RBS RFS
Global Global UK Retail & US Retail & Retail & Retail & Share of Holdings
Banking & Transaction Commercial Commercial Commercial Commercial Central Shared minority Total
Markets Services Banking Banking Banking Banking Items Assets interest 2008 2007
£m £m £m £m £m £m £m £m £m £m £m
At 1 January 586 170 3,281 304 418 183 14 16 1,480 6,452 3,935
Transfers to disposal groups — — ——————(767) (767) —
Currency translation
and other adjustments 496 52 12 219 147 57 ——458 1,441 137
Acquisition of subsidiaries — — ——— — — ———2,221
Disposal of subsidiaries ——(108) — (70)————(178) —
Net increase in provisions
of discontinued operations — — ——— — — ———46
Amounts written-off (307) (34) (1,414) (710) (174) (153) (64) (16) (276) (3,148) (2,011)
Recoveries of amounts
previously written-off 10 1 113 80 7—50 — 58 319 342
Charge to income statement 2,718 59 1,965 1,039 526 171 ——613 7,091 1,946
Discount unwind (12) (3) (140)—(32)(6)— — (1) (194) (164)
At 31 December 3,491 245 3,709 932 822 252 ——1,565 11,016 6,452