RBS 2008 Annual Report Download - page 74
Download and view the complete annual report
Please find page 74 of the 2008 RBS annual report below. You can navigate through the pages in the report by either clicking on the pages listed below, or by using the keyword search tool below to find specific information within the annual report.-
 1
1 -
2
-
3
-
4
-
5
-
6
-
7
-
8
-
9
-
10
-
11
-
12
-
13
-
14
-
15
-
16
-
17
-
18
-
19
-
20
-
21
-
22
-
23
-
24
-
25
-
26
-
27
-
28
-
29
-
30
-
31
-
32
-
33
-
34
-
35
-
36
-
37
-
38
-
39
-
40
-
41
-
42
-
43
-
44
-
45
-
46
-
47
-
48
-
49
-
50
-
51
-
52
-
53
-
54
-
55
-
56
-
57
-
58
-
59
-
60
-
61
-
62
-
63
-
 64
64 -
 65
65 -
 66
66 -
 67
67 -
 68
68 -
 69
69 -
 70
70 -
 71
71 -
 72
72 -
 73
73 -
 74
74 -
 75
75 -
 76
76 -
 77
77 -
 78
78 -
 79
79 -
 80
80 -
 81
81 -
 82
82 -
 83
83 -
 84
84 -
85
-
86
-
87
-
88
-
89
-
90
-
91
-
92
-
93
-
94
-
95
-
96
-
97
-
98
-
99
-
100
-
101
-
102
-
103
-
104
-
105
-
106
-
107
-
108
-
109
-
110
-
111
-
112
-
113
-
114
-
115
-
116
-
117
-
118
-
119
-
120
-
121
-
122
-
123
-
124
-
125
-
126
-
127
-
128
-
129
-
130
-
131
-
132
-
133
-
134
-
135
-
136
-
137
-
138
-
139
-
140
-
141
-
142
-
143
-
144
-
145
-
146
-
147
-
148
-
149
-
150
-
151
-
152
-
153
-
154
-
155
-
156
-
157
-
158
-
159
-
160
-
161
-
162
-
163
-
164
-
165
-
166
-
167
-
168
-
169
-
170
-
171
-
172
-
173
-
174
-
175
-
176
-
177
-
178
-
179
-
180
-
181
-
182
-
183
-
184
-
185
-
186
-
187
-
188
-
189
-
190
-
191
-
192
-
193
-
194
-
195
-
196
-
197
-
198
-
199
-
200
-
201
-
202
-
203
-
204
-
205
-
206
-
207
-
208
-
209
-
210
-
211
-
212
-
213
-
214
-
215
-
216
-
217
-
218
-
219
-
220
-
221
-
222
-
223
-
224
-
225
-
226
-
227
-
228
-
229
-
230
-
231
-
232
-
233
-
234
-
235
-
236
-
237
-
238
-
239
-
240
-
241
-
242
-
243
-
244
-
245
-
246
-
247
-
248
-
249
-
250
-
251
-
252
-
253
-
254
-
255
-
256
-
257
-
258
-
259
-
260
-
261
-
262
-
263
-
264
-
265
-
266
-
267
-
268
-
269
-
270
-
271
-
272
-
273
-
274
-
275
-
276
-
277
-
278
-
279
-
280
-
281
-
282
-
283
-
284
-
285
-
286
-
287
-
288
-
289
-
290
-
291
-
292
-
293
-
294
-
295
-
296
-
297
-
298
-
299
 |
 |

73RBS Group Annual Report and Accounts 2008
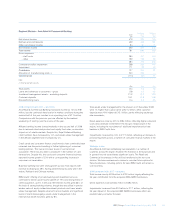
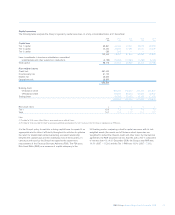
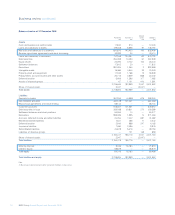
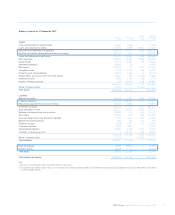
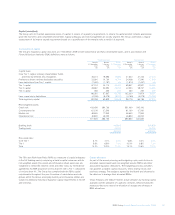
Capital resources
The following table analyses the Group’s regulatory capital resources on a fully consolidated basis at 31 December:
2008 2007 2006 2005 2004
£m £m £m £m £m
Capital base
Tier 1 capital 69,847 44,364 30,041 28,218 22,694
Tier 2 capital 32,223 33,693 27,491 22,437 20,229
Tier 3 capital 260 200 ———
102,330 78,257 57,532 50,655 42,923
Less: investments in insurance subsidiaries, associated
undertakings and other supervisory deductions (4,155) (10,283) (10,583) (7,282) (5,165)
Total capital 98,175 67,974 46,949 43,373 37,758
Risk-weighted assets
Credit risk 551,400
Counterparty risk 61,100
Market risk 46,500
Operational risk 36,800
695,800
Banking book:
On-balance sheet 480,200 318,600 303,300 261,800
Off-balance sheet 84,600 59,400 51,500 44,900
Trading book 44,200 22,300 16,200 17,100
609,000 400,300 371,000 323,800
Risk asset ratios %%%%%
Tier 1 10.0 7.3 7.5 7.6 7.0
Total 14.1 11.2 11.7 11.7 11.7
Notes:
(1) The data for 2008 are on a Basel II basis; prior periods are on a Basel I basis.
(2) The data for 2004 are under UK GAAP as previously published and regulated. As from 1 January 2005, the Group is regulated on an IFRS basis.
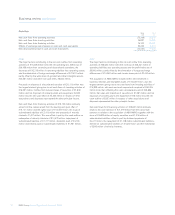
It is the Group’s policy to maintain a strong capital base, to expand it as
appropriate and to utilise it efficiently throughout its activities to optimise
the return to shareholders while maintaining a prudent relationship
between the capital base and the underlying risks of the business. In
carrying out this policy, the Group has regard to the supervisory
requirements of the Financial Services Authority (FSA). The FSA uses
Risk Asset Ratio (RAR) as a measure of capital adequacy in the
UK banking sector, comparing a bank’s capital resources with its risk-
weighted assets (the assets and off-balance sheet exposures are
‘weighted’ to reflect the inherent credit and other risks); by international
agreement, the RAR should be not less than 8% with a Tier 1 component
of not less than 4%. At 31 December 2008, the Group’s total RAR was
14.1% (2007 – 11.2%) and the Tier 1 RAR was 10.0% (2007 – 7.3%).