RBS 2008 Annual Report Download - page 112
Download and view the complete annual report
Please find page 112 of the 2008 RBS annual report below. You can navigate through the pages in the report by either clicking on the pages listed below, or by using the keyword search tool below to find specific information within the annual report.-
 1
1 -
2
-
3
-
4
-
5
-
6
-
7
-
8
-
9
-
10
-
11
-
12
-
13
-
14
-
15
-
16
-
17
-
18
-
19
-
20
-
21
-
22
-
23
-
24
-
25
-
26
-
27
-
28
-
29
-
30
-
31
-
32
-
33
-
34
-
35
-
36
-
37
-
38
-
39
-
40
-
41
-
42
-
43
-
44
-
45
-
46
-
47
-
48
-
49
-
50
-
51
-
52
-
53
-
54
-
55
-
56
-
57
-
58
-
59
-
60
-
61
-
62
-
63
-
64
-
65
-
66
-
67
-
68
-
69
-
70
-
71
-
72
-
73
-
74
-
75
-
76
-
77
-
78
-
79
-
80
-
81
-
82
-
83
-
84
-
85
-
86
-
87
-
88
-
89
-
90
-
91
-
92
-
93
-
94
-
95
-
96
-
97
-
98
-
99
-
100
-
101
-
 102
102 -
 103
103 -
 104
104 -
 105
105 -
 106
106 -
 107
107 -
 108
108 -
 109
109 -
 110
110 -
 111
111 -
 112
112 -
 113
113 -
 114
114 -
 115
115 -
 116
116 -
 117
117 -
 118
118 -
 119
119 -
 120
120 -
 121
121 -
 122
122 -
123
-
124
-
125
-
126
-
127
-
128
-
129
-
130
-
131
-
132
-
133
-
134
-
135
-
136
-
137
-
138
-
139
-
140
-
141
-
142
-
143
-
144
-
145
-
146
-
147
-
148
-
149
-
150
-
151
-
152
-
153
-
154
-
155
-
156
-
157
-
158
-
159
-
160
-
161
-
162
-
163
-
164
-
165
-
166
-
167
-
168
-
169
-
170
-
171
-
172
-
173
-
174
-
175
-
176
-
177
-
178
-
179
-
180
-
181
-
182
-
183
-
184
-
185
-
186
-
187
-
188
-
189
-
190
-
191
-
192
-
193
-
194
-
195
-
196
-
197
-
198
-
199
-
200
-
201
-
202
-
203
-
204
-
205
-
206
-
207
-
208
-
209
-
210
-
211
-
212
-
213
-
214
-
215
-
216
-
217
-
218
-
219
-
220
-
221
-
222
-
223
-
224
-
225
-
226
-
227
-
228
-
229
-
230
-
231
-
232
-
233
-
234
-
235
-
236
-
237
-
238
-
239
-
240
-
241
-
242
-
243
-
244
-
245
-
246
-
247
-
248
-
249
-
250
-
251
-
252
-
253
-
254
-
255
-
256
-
257
-
258
-
259
-
260
-
261
-
262
-
263
-
264
-
265
-
266
-
267
-
268
-
269
-
270
-
271
-
272
-
273
-
274
-
275
-
276
-
277
-
278
-
279
-
280
-
281
-
282
-
283
-
284
-
285
-
286
-
287
-
288
-
289
-
290
-
291
-
292
-
293
-
294
-
295
-
296
-
297
-
298
-
299
 |
 |

111RBS Group Annual Report and Accounts 2008
The Group is exposed to the following non-traded risks:
Interest Rate Risk in the Banking Book (IRRBB) represents exposures
to instruments whose values vary with the level or volatility of interest
rates. These instruments include, but are not limited to, loans, debt
securities, equity shares, deposits, certificates of deposits, and other
debt securities issued, loan capital and derivatives. Hedging
instruments used to mitigate these risks include related derivatives such
as options, futures, forwards and swaps. Interest rate risk arises from
the Group’s non-trading activities in four principal forms:
•Repricing risk – arises from differences in the repricing terms of the
Group’s assets and liabilities.
•Optionality – arises where a customer has an option to exit a deal
early.
•Basis risk – arises, for example, where one month LIBOR is used to
fund base rate assets.
•Yield curve risk – arises as a result of non-parallel changes in the
yield curve.
From an economic perspective, it is the Group’s policy to minimise the
sensitivity to changes in interest rates in its retail and commercial
businesses and, where interest rate risk is retained, to ensure that
appropriate resources, measures and limits are applied.
Non-trading interest rate risk is calculated in each business on the basis
of establishing the repricing behaviour of each asset, liability and off-
balance sheet product. For many retail and commercial products, the
actual interest rate repricing characteristics differ from the contractual
repricing. In most cases, the repricing maturity is determined by the
market interest rate that most closely fits the historical behaviour of the
product interest rate. For non-interest bearing current accounts, the
repricing maturity is determined by the stability of the portfolio. The
repricing maturities used are approved by Group Treasury and
divisional asset and liability committees at least annually. Key
conventions are reviewed annually by GALCO.
A static maturity gap report is produced as at the month-end for each
business, in each functional currency based on the behavioural
repricing for each product. It is Group policy to include in the gap
report, non-financial assets and liabilities, mainly property, plant and
equipment and the Group’s capital and reserves, spread over medium
and longer term maturities. The report includes hedge transactions,
principally derivatives.
Any residual non-trading interest rate exposures are controlled by
limiting repricing mismatches in the individual business balance sheets.
Potential exposures to interest rate movements in the medium to long-
term are measured and controlled using a version of the same VaR
methodology that is used for the Group’s trading portfolios. Net accrual
income exposures are measured and controlled in terms of sensitivity
over time to movements in interest rates.
Risk is managed within VaR limits approved by GALCO, through the
execution of cash and derivative instruments (see Note 13 on the
accounts, on page 214). Execution of the hedging is carried out by the
relevant division through the Group`s treasury functions. The residual
risk position is reported to divisional asset and liability committees,
GALCO and the Board.
Foreign Exchange Risk in the Banking Book (FXRBB) represents
exposures to changes in the values of current holdings and future
cashflows denominated in other currencies. Hedging instruments used
to mitigate these risks include foreign currency options, currency swaps,
futures, forwards and deposits. Foreign exchange risk results from the
Group’s investments in overseas subsidiaries, associates and branches
in three principal forms:
(i) Structural foreign currency exposures that arise from net investment
in overseas subsidiaries, associates and branches;
(ii) Transactional/commercial foreign currency exposures that arise from
mismatches in the currency balance sheet; and
(iii) Foreign currency profit streams.
Equity Risk in the Banking Book (ERBB) is defined as the potential
variation in the Group’s non-trading income and reserves arising from
changes in equity prices/income. This risk may crystallise during the
course of normal business activities or in stressed market conditions.
Equity positions in the Group’s banking book are retained to achieve
strategic objectives, support venture capital transactions or in respect of
restructuring arrangements. From an economic perspective, it is the
Group’s policy to ensure that equity exposures in the banking book are
identified, monitored and controlled, with the aim of maximising their
potential strategic or business value.
The commercial decision to invest in equity holdings is taken by GEMC,
GCC or an appropriate sub-committee within delegated authority.
Investments of a strategic nature are referred to GEMC for approval;
those involving the purchase or sale by the Group or subsidiary
companies also require Board approval, after consideration by GEMC.
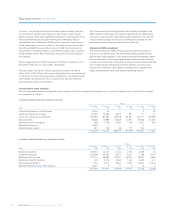
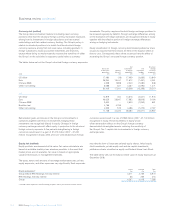
Treasury (audited)
The Group’s treasury activities include its money market business and
the management of internal funds flow within the Group’s businesses.
In addition, this includes GBM trading portfolio assets that have been
reclassified to available-for-sale. Money market portfolios include cash
instruments (principally debt securities, loans and deposits) and related
hedging derivatives. VaR for the Group’s treasury portfolios, which
relates mainly to interest rate risk including credit spreads, was £52.0
million at 31 December 2008 (2007 – £5.5 million). During the year
the maximum VaR was £52.0 million (2007 – £6.4 million), the minimum
£4.8 million (2007 – £1.3 million) and the average £8.3 million
(2007 – £3.7 million).