RBS 2008 Annual Report Download - page 274
Download and view the complete annual report
Please find page 274 of the 2008 RBS annual report below. You can navigate through the pages in the report by either clicking on the pages listed below, or by using the keyword search tool below to find specific information within the annual report.-
 1
1 -
2
-
3
-
4
-
5
-
6
-
7
-
8
-
9
-
10
-
11
-
12
-
13
-
14
-
15
-
16
-
17
-
18
-
19
-
20
-
21
-
22
-
23
-
24
-
25
-
26
-
27
-
28
-
29
-
30
-
31
-
32
-
33
-
34
-
35
-
36
-
37
-
38
-
39
-
40
-
41
-
42
-
43
-
44
-
45
-
46
-
47
-
48
-
49
-
50
-
51
-
52
-
53
-
54
-
55
-
56
-
57
-
58
-
59
-
60
-
61
-
62
-
63
-
64
-
65
-
66
-
67
-
68
-
69
-
70
-
71
-
72
-
73
-
74
-
75
-
76
-
77
-
78
-
79
-
80
-
81
-
82
-
83
-
84
-
85
-
86
-
87
-
88
-
89
-
90
-
91
-
92
-
93
-
94
-
95
-
96
-
97
-
98
-
99
-
100
-
101
-
102
-
103
-
104
-
105
-
106
-
107
-
108
-
109
-
110
-
111
-
112
-
113
-
114
-
115
-
116
-
117
-
118
-
119
-
120
-
121
-
122
-
123
-
124
-
125
-
126
-
127
-
128
-
129
-
130
-
131
-
132
-
133
-
134
-
135
-
136
-
137
-
138
-
139
-
140
-
141
-
142
-
143
-
144
-
145
-
146
-
147
-
148
-
149
-
150
-
151
-
152
-
153
-
154
-
155
-
156
-
157
-
158
-
159
-
160
-
161
-
162
-
163
-
164
-
165
-
166
-
167
-
168
-
169
-
170
-
171
-
172
-
173
-
174
-
175
-
176
-
177
-
178
-
179
-
180
-
181
-
182
-
183
-
184
-
185
-
186
-
187
-
188
-
189
-
190
-
191
-
192
-
193
-
194
-
195
-
196
-
197
-
198
-
199
-
200
-
201
-
202
-
203
-
204
-
205
-
206
-
207
-
208
-
209
-
210
-
211
-
212
-
213
-
214
-
215
-
216
-
217
-
218
-
219
-
220
-
221
-
222
-
223
-
224
-
225
-
226
-
227
-
228
-
229
-
230
-
231
-
232
-
233
-
234
-
235
-
236
-
237
-
238
-
239
-
240
-
241
-
242
-
243
-
244
-
245
-
246
-
247
-
248
-
249
-
250
-
251
-
252
-
253
-
254
-
255
-
256
-
257
-
258
-
259
-
260
-
261
-
262
-
263
-
 264
264 -
 265
265 -
 266
266 -
 267
267 -
 268
268 -
 269
269 -
 270
270 -
 271
271 -
 272
272 -
 273
273 -
 274
274 -
 275
275 -
 276
276 -
 277
277 -
 278
278 -
 279
279 -
 280
280 -
 281
281 -
 282
282 -
 283
283 -
 284
284 -
285
-
286
-
287
-
288
-
289
-
290
-
291
-
292
-
293
-
294
-
295
-
296
-
297
-
298
-
299
 |
 |

273RBS Group Annual Report and Accounts 2008
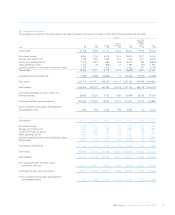
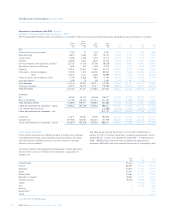
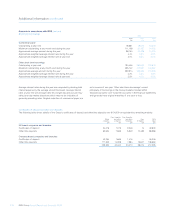
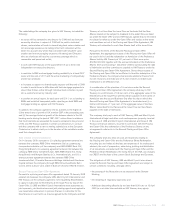
Analysis of write-offs
The following table analyses amounts written-off by geographical area and type of domestic customer.
IFRS
2008 2007 2006 2005 2004
£m £m £m £m £m
Domestic
Manufacturing 61 29 41 40 55
Construction 51 21 29 17 12
Finance 31 47 17 21 19
Service industries and business activities 299 190 212 176 163
Agriculture, forestry and fishing 5 4549
Property 34 9625 33
Individuals – home mortgages 1 —544
– others 938 909 1,021 950 516
Finance leases and instalment credit 26 13 24 15 90
Total domestic 1,446 1,222 1,360 1,252 901
Foreign 1,702 789 481 788 548
Total write-offs (1) 3,148 2,011 1,841 2,040 1,449
Note:
(1) Excludes £2 million written-off in respect of loans and advances to banks in 2005.
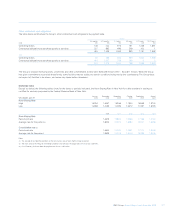
Analysis of recoveries
The following table analyses recoveries of amounts written-off by geographical area and type of domestic customer.
IFRS
2008 2007 2006 2005 2004
£m £m £m £m £m
Domestic
Manufacturing 2 —— 1 1
Construction — —— 1—
Finance 2 ——— 2
Service industries and business activities 12 7521
Property — —12—
Individuals – home mortgages — ——— 1
– others 96 143 101 84 78
Finance leases and instalment credit 4 8 12 72
Total domestic 116 158 119 97 85
Foreign 203 184 96 75 59
Total recoveries 319 342 215 172 144