RBS 2008 Annual Report Download - page 126
Download and view the complete annual report
Please find page 126 of the 2008 RBS annual report below. You can navigate through the pages in the report by either clicking on the pages listed below, or by using the keyword search tool below to find specific information within the annual report.-
 1
1 -
2
-
3
-
4
-
5
-
6
-
7
-
8
-
9
-
10
-
11
-
12
-
13
-
14
-
15
-
16
-
17
-
18
-
19
-
20
-
21
-
22
-
23
-
24
-
25
-
26
-
27
-
28
-
29
-
30
-
31
-
32
-
33
-
34
-
35
-
36
-
37
-
38
-
39
-
40
-
41
-
42
-
43
-
44
-
45
-
46
-
47
-
48
-
49
-
50
-
51
-
52
-
53
-
54
-
55
-
56
-
57
-
58
-
59
-
60
-
61
-
62
-
63
-
64
-
65
-
66
-
67
-
68
-
69
-
70
-
71
-
72
-
73
-
74
-
75
-
76
-
77
-
78
-
79
-
80
-
81
-
82
-
83
-
84
-
85
-
86
-
87
-
88
-
89
-
90
-
91
-
92
-
93
-
94
-
95
-
96
-
97
-
98
-
99
-
100
-
101
-
102
-
103
-
104
-
105
-
106
-
107
-
108
-
109
-
110
-
111
-
112
-
113
-
114
-
115
-
 116
116 -
 117
117 -
 118
118 -
 119
119 -
 120
120 -
 121
121 -
 122
122 -
 123
123 -
 124
124 -
 125
125 -
 126
126 -
 127
127 -
 128
128 -
 129
129 -
 130
130 -
 131
131 -
 132
132 -
 133
133 -
 134
134 -
 135
135 -
 136
136 -
137
-
138
-
139
-
140
-
141
-
142
-
143
-
144
-
145
-
146
-
147
-
148
-
149
-
150
-
151
-
152
-
153
-
154
-
155
-
156
-
157
-
158
-
159
-
160
-
161
-
162
-
163
-
164
-
165
-
166
-
167
-
168
-
169
-
170
-
171
-
172
-
173
-
174
-
175
-
176
-
177
-
178
-
179
-
180
-
181
-
182
-
183
-
184
-
185
-
186
-
187
-
188
-
189
-
190
-
191
-
192
-
193
-
194
-
195
-
196
-
197
-
198
-
199
-
200
-
201
-
202
-
203
-
204
-
205
-
206
-
207
-
208
-
209
-
210
-
211
-
212
-
213
-
214
-
215
-
216
-
217
-
218
-
219
-
220
-
221
-
222
-
223
-
224
-
225
-
226
-
227
-
228
-
229
-
230
-
231
-
232
-
233
-
234
-
235
-
236
-
237
-
238
-
239
-
240
-
241
-
242
-
243
-
244
-
245
-
246
-
247
-
248
-
249
-
250
-
251
-
252
-
253
-
254
-
255
-
256
-
257
-
258
-
259
-
260
-
261
-
262
-
263
-
264
-
265
-
266
-
267
-
268
-
269
-
270
-
271
-
272
-
273
-
274
-
275
-
276
-
277
-
278
-
279
-
280
-
281
-
282
-
283
-
284
-
285
-
286
-
287
-
288
-
289
-
290
-
291
-
292
-
293
-
294
-
295
-
296
-
297
-
298
-
299
 |
 |

125
RBS Group Annual Report and Accounts 2008
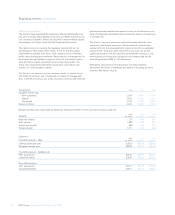
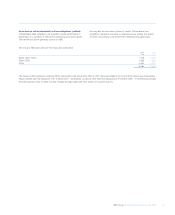
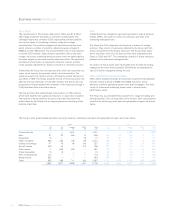
The tables below analyse carrying values of these debt securities by measurement classification and rating and fair value hierarchy level.
RMBS
Non Prime
Sub-prime conforming Guaranteed Other CMBS CDOs/CLOs Other ABS Total
2008 £m £m £m £m £m £m £m £m
AAA rated (1)
Held-for-trading 393 203 18,622 6,226 2,306 4,698 380 32,828
Available-for-sale 522 1,914 22,546 18,764 982 6,459 4,826 56,013
Loans and receivables 431 1,415 — 476 405 652 1,443 4,822
Designated at fair value 16 ——166 9——191
1,362 3,532 41,168 25,632 3,702 11,809 6,649 93,854
BBB- and above rated (1)
Held-for-trading 564 79 — 985 407 1,439 890 4,364
Available-for-sale 267 194 — 338 144 1,642 1,292 3,877
Loans and receivables 105 64 — 94 1,031 561 1,296 3,151
Designated at fair value ———— 4—41 45
936 337 — 1,417 1,586 3,642 3,519 11,437
Non-investment grade (1)
Held-for-trading 636 69 — 59 38 1,299 120 2,221
Available-for-sale 124 74 — 47 — 1,057 50 1,352
Loans and receivables 30 3————72 105
790 146 — 106 38 2,356 242 3,678
Not publicly rated (1)
Held-for-trading 1192—338 115 466
Available-for-sale — 1———421 404 826
Loans and receivables ———— 171 810 882
12921830 1,329 2,174
Total
Held-for-trading 1,594 352 18,631 7,272 2,751 7,774 1,505 39,879
Available-for-sale 913 2,183 22,546 19,149 1,126 9,579 6,572 62,068
Loans and receivables 566 1,482 — 570 1,437 1,284 3,621 8,960
Designated at fair value 16 ——166 13 — 41 236
Total 3,089 4,017 41,177 27,157 5,327 18,637 11,739 111,143
Of which carried at fair value:
Level 2 (2) 2,459 2,485 40,942 26,442 3,316 14,643 6,677 96,964
Level 3 (3) 64 50 235 145 574 2,710 1,441 5,219
2,523 2,535 41,177 26,587 3,890 17,353 8,118 102,183
Notes:
(1) Credit ratings are based on those from S&P, Fitch or Moody’s and have been mapped on to S&P scale.
(2) Valued using techniques based significantly on observable market data. Instruments in this level are valued using:
(a) quoted prices for similar instruments in markets which are not considered to be active; or
(b) valuation techniques where all the inputs that have a significant effect on the valuation are directly or indirectly based on observable market data.
(3) Instruments in this category have been valued using a valuation technique where at least one input which could have a significant effect on the instrument’s valuation is not based on
observable market data.