RBS 2008 Annual Report Download - page 198
Download and view the complete annual report
Please find page 198 of the 2008 RBS annual report below. You can navigate through the pages in the report by either clicking on the pages listed below, or by using the keyword search tool below to find specific information within the annual report.-
 1
1 -
2
-
3
-
4
-
5
-
6
-
7
-
8
-
9
-
10
-
11
-
12
-
13
-
14
-
15
-
16
-
17
-
18
-
19
-
20
-
21
-
22
-
23
-
24
-
25
-
26
-
27
-
28
-
29
-
30
-
31
-
32
-
33
-
34
-
35
-
36
-
37
-
38
-
39
-
40
-
41
-
42
-
43
-
44
-
45
-
46
-
47
-
48
-
49
-
50
-
51
-
52
-
53
-
54
-
55
-
56
-
57
-
58
-
59
-
60
-
61
-
62
-
63
-
64
-
65
-
66
-
67
-
68
-
69
-
70
-
71
-
72
-
73
-
74
-
75
-
76
-
77
-
78
-
79
-
80
-
81
-
82
-
83
-
84
-
85
-
86
-
87
-
88
-
89
-
90
-
91
-
92
-
93
-
94
-
95
-
96
-
97
-
98
-
99
-
100
-
101
-
102
-
103
-
104
-
105
-
106
-
107
-
108
-
109
-
110
-
111
-
112
-
113
-
114
-
115
-
116
-
117
-
118
-
119
-
120
-
121
-
122
-
123
-
124
-
125
-
126
-
127
-
128
-
129
-
130
-
131
-
132
-
133
-
134
-
135
-
136
-
137
-
138
-
139
-
140
-
141
-
142
-
143
-
144
-
145
-
146
-
147
-
148
-
149
-
150
-
151
-
152
-
153
-
154
-
155
-
156
-
157
-
158
-
159
-
160
-
161
-
162
-
163
-
164
-
165
-
166
-
167
-
168
-
169
-
170
-
171
-
172
-
173
-
174
-
175
-
176
-
177
-
178
-
179
-
180
-
181
-
182
-
183
-
184
-
185
-
186
-
187
-
 188
188 -
 189
189 -
 190
190 -
 191
191 -
 192
192 -
 193
193 -
 194
194 -
 195
195 -
 196
196 -
 197
197 -
 198
198 -
 199
199 -
 200
200 -
 201
201 -
 202
202 -
 203
203 -
 204
204 -
 205
205 -
 206
206 -
 207
207 -
 208
208 -
209
-
210
-
211
-
212
-
213
-
214
-
215
-
216
-
217
-
218
-
219
-
220
-
221
-
222
-
223
-
224
-
225
-
226
-
227
-
228
-
229
-
230
-
231
-
232
-
233
-
234
-
235
-
236
-
237
-
238
-
239
-
240
-
241
-
242
-
243
-
244
-
245
-
246
-
247
-
248
-
249
-
250
-
251
-
252
-
253
-
254
-
255
-
256
-
257
-
258
-
259
-
260
-
261
-
262
-
263
-
264
-
265
-
266
-
267
-
268
-
269
-
270
-
271
-
272
-
273
-
274
-
275
-
276
-
277
-
278
-
279
-
280
-
281
-
282
-
283
-
284
-
285
-
286
-
287
-
288
-
289
-
290
-
291
-
292
-
293
-
294
-
295
-
296
-
297
-
298
-
299
 |
 |

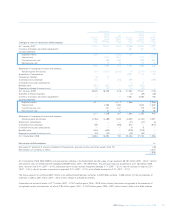
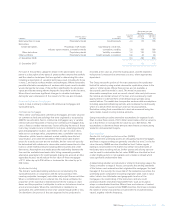
197RBS Group Annual Report and Accounts 2008
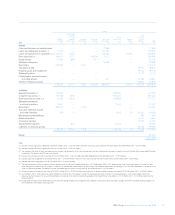
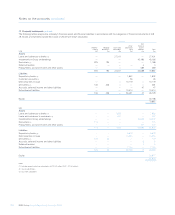
Group
Designated
as at fair Non
value Other financial
Held-for- through Hedging Available- Loans and (amortised Finance assets/
trading profit or loss derivatives for-sale receivables cost) leases liabilities Total
2007 £m £m £m £m £m £m £m £m £m
Assets
Cash and balances at central banks —— —17,866 — 17,866
Loans and advances to banks (1) 71,639 ——147,821 — 219,460
Loans and advances to customers (2, 3) 103,811 3,067 — 709,090 12,570 828,538
Debt securities (4) 190,671 5,777 95,536 2,672 — 294,656
Equity shares 37,546 7,866 7,614 ——53,026
Settlement balances — — — 16,589 — 16,589
Derivatives 274,849 — 2,553 —— — 277,402
Intangible assets 49,916 49,916
Property, plant and equipment 18,745 18,745
Deferred taxation ———————3,119 3,119
Prepayments, accrued income
and other assets —— —877 — 14,785 15,662
Assets of disposal groups 45,850 45,850
678,516 16,710 2,553 103,150 894,915 12,570 132,415 1,840,829
Liabilities
Deposits by banks (5) 65,491 — 246,803 — 312,294
Customer accounts (6, 7) 60,426 7,505 614,432 — 682,363
Debt securities in issue (8, 9) 9,455 41,834 222,883 — 274,172
Settlement balances
and short positions 73,501 — 17,520 — 91,021
Derivatives 269,343 — 2,709 —— 272,052
Accruals, deferred income
and other liabilities 209 — 1,545 19 32,435 34,208
Retirement benefit liabilities 460 460
Deferred taxation 5,400 5,400
Insurance liabilities 10,162 10,162
Subordinated liabilities — 897 37,146 ——38,043
Liabilities of disposal groups 29,228 29,228
478,425 50,236 2,709 1,140,329 19 77,685 1,749,403
Equity 91,426
1,840,829
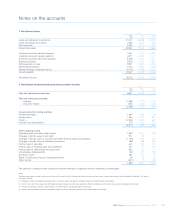
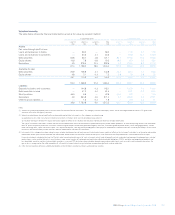
Notes:
(1) Includes reverse repurchase agreements of £58,771 million (2007 – £175,941 million) and items in the course of collection from other banks of £2,888 million (2007 – £3,095 million).
(2) Includes reverse repurchase agreements of £39,313 million (2007 – £142,357 million).
(3) The change in fair value of loans and advances to customers designated as at fair value through profit and loss attributable to changes in credit risk was £328 million for the year and £440 million
cumulatively. The amounts for 2007 were not material.
(4) Includes treasury bills and similar securities of £31,509 million (2007 – £16,315 million) and other eligible bills of £25,028 million (2007 – £1,914 million).
(5) Includes repurchase agreements of £83,666 million (2007 – £163,038 million) and items in the course of transmission to other banks of £542 million (2007 – £372 million).
(6) Includes repurchase agreements of £58,143 million (2007 – £134,916 million).
(7) The carrying amount of other customer accounts designated as at fair value through profit or loss is £47 million lower (2007 – £77 million greater) than the principal amount. No amounts have
been recognised in profit or loss for changes in credit risk associated with these liabilities as the changes are immaterial measured as the change in fair value from movements in the period in the
credit risk premium payable. The amounts include investment contracts with a carrying value of £5,364 million (2007 – £5,555 million).
(8) Comprises bonds and medium term notes of £156,841 million (2007 – £119,578 million) and certificates of deposit and other commercial paper of £143,448 million (2007 – £154,594 million).
(9) £1,054 million (2007 – £162 million) has been recognised in profit or loss for changes in credit risk associated with debt securities in issue designated as at fair value through profit or loss
measured as the change in fair value from movements in the period in the credit risk premium payable by the Group. The carrying amount is £1,145 million (2007 – £317 million) lower than the
principal amount.
(10) During 2008 the Group reclassified financial assets from the held-for-trading and available-for-sale categories into the loans and receivables category and from the held-for-trading category into
the available-for-sale category (see page 208).