RBS 2008 Annual Report Download - page 62
Download and view the complete annual report
Please find page 62 of the 2008 RBS annual report below. You can navigate through the pages in the report by either clicking on the pages listed below, or by using the keyword search tool below to find specific information within the annual report.-
 1
1 -
2
-
3
-
4
-
5
-
6
-
7
-
8
-
9
-
10
-
11
-
12
-
13
-
14
-
15
-
16
-
17
-
18
-
19
-
20
-
21
-
22
-
23
-
24
-
25
-
26
-
27
-
28
-
29
-
30
-
31
-
32
-
33
-
34
-
35
-
36
-
37
-
38
-
39
-
40
-
41
-
42
-
43
-
44
-
45
-
46
-
47
-
48
-
49
-
50
-
51
-
 52
52 -
 53
53 -
 54
54 -
 55
55 -
 56
56 -
 57
57 -
 58
58 -
 59
59 -
 60
60 -
 61
61 -
 62
62 -
 63
63 -
 64
64 -
 65
65 -
 66
66 -
 67
67 -
 68
68 -
 69
69 -
 70
70 -
 71
71 -
 72
72 -
73
-
74
-
75
-
76
-
77
-
78
-
79
-
80
-
81
-
82
-
83
-
84
-
85
-
86
-
87
-
88
-
89
-
90
-
91
-
92
-
93
-
94
-
95
-
96
-
97
-
98
-
99
-
100
-
101
-
102
-
103
-
104
-
105
-
106
-
107
-
108
-
109
-
110
-
111
-
112
-
113
-
114
-
115
-
116
-
117
-
118
-
119
-
120
-
121
-
122
-
123
-
124
-
125
-
126
-
127
-
128
-
129
-
130
-
131
-
132
-
133
-
134
-
135
-
136
-
137
-
138
-
139
-
140
-
141
-
142
-
143
-
144
-
145
-
146
-
147
-
148
-
149
-
150
-
151
-
152
-
153
-
154
-
155
-
156
-
157
-
158
-
159
-
160
-
161
-
162
-
163
-
164
-
165
-
166
-
167
-
168
-
169
-
170
-
171
-
172
-
173
-
174
-
175
-
176
-
177
-
178
-
179
-
180
-
181
-
182
-
183
-
184
-
185
-
186
-
187
-
188
-
189
-
190
-
191
-
192
-
193
-
194
-
195
-
196
-
197
-
198
-
199
-
200
-
201
-
202
-
203
-
204
-
205
-
206
-
207
-
208
-
209
-
210
-
211
-
212
-
213
-
214
-
215
-
216
-
217
-
218
-
219
-
220
-
221
-
222
-
223
-
224
-
225
-
226
-
227
-
228
-
229
-
230
-
231
-
232
-
233
-
234
-
235
-
236
-
237
-
238
-
239
-
240
-
241
-
242
-
243
-
244
-
245
-
246
-
247
-
248
-
249
-
250
-
251
-
252
-
253
-
254
-
255
-
256
-
257
-
258
-
259
-
260
-
261
-
262
-
263
-
264
-
265
-
266
-
267
-
268
-
269
-
270
-
271
-
272
-
273
-
274
-
275
-
276
-
277
-
278
-
279
-
280
-
281
-
282
-
283
-
284
-
285
-
286
-
287
-
288
-
289
-
290
-
291
-
292
-
293
-
294
-
295
-
296
-
297
-
298
-
299
 |
 |

61RBS Group Annual Report and Accounts 2008
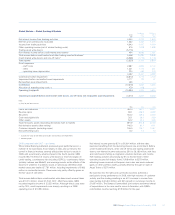
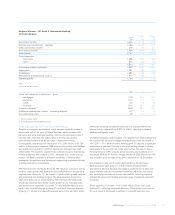
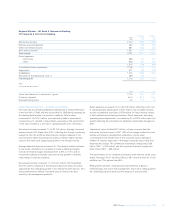
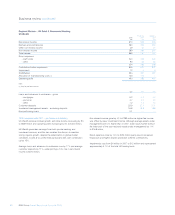
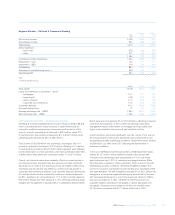
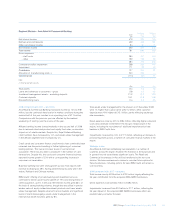
Regional Markets – Europe & Middle East Retail & Commercial Banking
Pro forma Statutory
2008 2007 2007
£m £m £m
Net interest income 1,152 1,066 1,014
Net fees and commissions 320 265 219
Other non-interest income 46 107 113
Non-interest income 366 372 332
Total income 1,518 1,438 1,346
Direct expenses
– staff costs 404 330 307
– other 159 173 152
563 503 459
Contribution before impairment 955 935 887
Impairment 526 136 118
Contribution 429 799 769
Allocation of manufacturing costs (1) 359 336 —
Operating profit 70 463 769
Note:
(1) Only for pro forma results.
£bn £bn £bn
Total assets 66.4 56.1 56.1
Loans and advances to customers – gross
– mortgages 24.6 18.3 18.3
– corporate 33.4 25.3 25.3
– other 3.7 4.2 4.2
Customer deposits 25.0 22.3 22.3
Non-performing loans 3.3 0.7 0.7
2008 compared with 2007 – pro forma
The significant deterioration in global and local market conditions has
impacted the main Europe & Middle East markets, with operating profit
falling to £70 million, 85% lower than in 2007. The main driver of this
reduction has been an increase of £390 million in impairments, albeit
from a low base, reflecting deterioration in credit quality particularly in
the property and construction sectors, as economic conditions have
slowed. Operating profit excluding impairment losses held steady at
£596 million.
Total income was up £80 million, 6% to £1,518 million benefiting from
movements in exchange rates. Adjusting for this, income declined by
5%. While average loans and deposits grew by 25% and 13%
respectively net interest margin reduced by 21bps in the year to 2.02%,
impacted primarily by higher funding costs and the effect of
discontinued businesses. Direct expenses were up 12% to £563 million.
At constant exchange rates direct expenses were flat reflecting the
benefit of cost saving initiatives. Impairment losses rose to £526 million
from £136 million reflecting the economic environment.
In sterling terms the results have been materially affected by the
movement in the euro exchange rate and references to percentage
movement in the following analysis are in constant currency terms.
Ulster Bank operating profit fell 76% to £117 million. Total income
decreased by 2% to £1,269 million; net interest income increased by
1%, with average loans and advances to customers up 12% in the year.
The benefit from the growth in lending, particularly in the first half of the
year has been offset by increased funding costs associated with the
wholesale funding market dislocation. Other income was 12% lower
than in 2007, reflecting a slowdown in particular in the bancassurance
and wealth businesses.
Average mortgage balances in Ulster Bank were 11% higher than 2007.
New mortgage volumes in the second half of the year were significantly
lower than in the first six months, although levels of redemptions have
also fallen.
Average deposit balances in Ulster Bank were largely flat year-on-year
reflecting the highly competitive market for resources in Ireland in 2008.
Deposit flows in Ulster Bank were strong in the latter part of the year
and into the early months of 2009. During 2008, we opened 119,000
new current accounts driven by particularly successful current account
switcher and student campaigns.
Direct expenses rose by 8% to £432 million, reflecting the full year
impact of the now completed investment programme in Ulster Bank’s
footprint and operations. Cost growth in the second half of 2008 was
significantly lower, reflecting disciplined management of the cost base.
Impairment losses in Ulster Bank rose to £394 million, reflecting the
impact on credit quality of the slowdown in the Irish economy, with the
final quarter showing notable decline in both activity and sentiment. This
was reflected in a significantly increased flow of cases into the problem
debt management process.