RBS 2008 Annual Report Download - page 129
Download and view the complete annual report
Please find page 129 of the 2008 RBS annual report below. You can navigate through the pages in the report by either clicking on the pages listed below, or by using the keyword search tool below to find specific information within the annual report.-
 1
1 -
2
-
3
-
4
-
5
-
6
-
7
-
8
-
9
-
10
-
11
-
12
-
13
-
14
-
15
-
16
-
17
-
18
-
19
-
20
-
21
-
22
-
23
-
24
-
25
-
26
-
27
-
28
-
29
-
30
-
31
-
32
-
33
-
34
-
35
-
36
-
37
-
38
-
39
-
40
-
41
-
42
-
43
-
44
-
45
-
46
-
47
-
48
-
49
-
50
-
51
-
52
-
53
-
54
-
55
-
56
-
57
-
58
-
59
-
60
-
61
-
62
-
63
-
64
-
65
-
66
-
67
-
68
-
69
-
70
-
71
-
72
-
73
-
74
-
75
-
76
-
77
-
78
-
79
-
80
-
81
-
82
-
83
-
84
-
85
-
86
-
87
-
88
-
89
-
90
-
91
-
92
-
93
-
94
-
95
-
96
-
97
-
98
-
99
-
100
-
101
-
102
-
103
-
104
-
105
-
106
-
107
-
108
-
109
-
110
-
111
-
112
-
113
-
114
-
115
-
116
-
117
-
118
-
 119
119 -
 120
120 -
 121
121 -
 122
122 -
 123
123 -
 124
124 -
 125
125 -
 126
126 -
 127
127 -
 128
128 -
 129
129 -
 130
130 -
 131
131 -
 132
132 -
 133
133 -
 134
134 -
 135
135 -
 136
136 -
 137
137 -
 138
138 -
 139
139 -
140
-
141
-
142
-
143
-
144
-
145
-
146
-
147
-
148
-
149
-
150
-
151
-
152
-
153
-
154
-
155
-
156
-
157
-
158
-
159
-
160
-
161
-
162
-
163
-
164
-
165
-
166
-
167
-
168
-
169
-
170
-
171
-
172
-
173
-
174
-
175
-
176
-
177
-
178
-
179
-
180
-
181
-
182
-
183
-
184
-
185
-
186
-
187
-
188
-
189
-
190
-
191
-
192
-
193
-
194
-
195
-
196
-
197
-
198
-
199
-
200
-
201
-
202
-
203
-
204
-
205
-
206
-
207
-
208
-
209
-
210
-
211
-
212
-
213
-
214
-
215
-
216
-
217
-
218
-
219
-
220
-
221
-
222
-
223
-
224
-
225
-
226
-
227
-
228
-
229
-
230
-
231
-
232
-
233
-
234
-
235
-
236
-
237
-
238
-
239
-
240
-
241
-
242
-
243
-
244
-
245
-
246
-
247
-
248
-
249
-
250
-
251
-
252
-
253
-
254
-
255
-
256
-
257
-
258
-
259
-
260
-
261
-
262
-
263
-
264
-
265
-
266
-
267
-
268
-
269
-
270
-
271
-
272
-
273
-
274
-
275
-
276
-
277
-
278
-
279
-
280
-
281
-
282
-
283
-
284
-
285
-
286
-
287
-
288
-
289
-
290
-
291
-
292
-
293
-
294
-
295
-
296
-
297
-
298
-
299
 |
 |

Business review continued
RBS Group Annual Report and Accounts 2008128
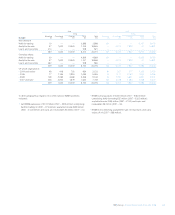
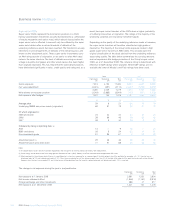
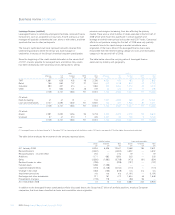
2008 2007
Prime Prime
Sub-prime Alt-A Guaranteed Other Total Sub-prime Alt-A Guaranteed Other Total
United States £m £m £m £m £m £m £m £m £m £m
Net exposure
Held-for-trading 302 346 18,577 968 20,193 2,953 2,189 15,502 1,419 22,063
Available-for-sale 53 760 14,887 4,409 20,109 — 640 10,504 1,359 12,503
Loans and receivables 3——215 218 —————
358 1,106 33,464 5,592 40,520 2,953 2,829 26,006 2,778 34,566
Carrying values
Held-for-trading 1,427 352 18,577 1,043 21,399 4,277 2,189 15,502 1,419 23,387
Available-for-sale 394 760 14,887 4,409 20,450 — 640 10,504 1,359 12,503
Loans and receivables 3——215 218 —————
1,824 1,112 33,464 5,667 42,067 4,277 2,829 26,006 2,778 35,890
Of which originated in:
– 2004 and earlier 474 122 5,534 709 6,839 746 165 2,532 406 3,849
– 2005 259 718 6,014 2,675 9,666 1,065 437 3,209 275 4,986
– 2006 718 115 1,689 614 3,136 1,734 1,188 5,557 1,017 9,496
– 2007 and later 373 157 20,227 1,669 22,426 732 1,039 14,708 1,080 17,559
1,824 1,112 33,464 5,667 42,067 4,277 2,829 26,006 2,778 35,890
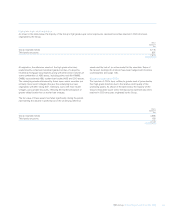
2008 2007
Non Non
Sub-prime conforming Prime Total Sub-prime conforming Prime Total
United Kingdom £m £m £m £m £m £m £m £m
Net exposure
Held-for-trading 33 — 258 291 150 724 2,411 3,285
Available-for-sale 154 1,423 3,446 5,023 7 157 931 1,095
Loans and receivables 205 1,482 118 1,805 5—— 5
Designated at fair value 16 — 166 182 18 — 72 90
408 2,905 3,988 7,301 180 881 3,414 4,475
Carrying values:
Held-for-trading 70 — 1,345 1,415 150 724 2,740 3,614
Available-for-sale 154 1,423 3,446 5,023 7 157 935 1,099
Loans and receivables 205 1,482 118 1,805 5—— 5
Designated at fair value 16 — 166 182 18 — 72 90
445 2,905 5,075 8,425 180 881 3,747 4,808
Of which originated in:
- 2004 and earlier 72 — 815 887 13 22 911 946
- 2005 42 652 1,000 1,694 1 10 512 523
- 2006 209 756 2,308 3,273 49 110 1,256 1,415
- 2007 and later 122 1,497 952 2,571 117 739 1,068 1,924
445 2,905 5,075 8,425 180 881 3,747 4,808