RBS 2008 Annual Report Download - page 292
Download and view the complete annual report
Please find page 292 of the 2008 RBS annual report below. You can navigate through the pages in the report by either clicking on the pages listed below, or by using the keyword search tool below to find specific information within the annual report.-
 1
1 -
2
-
3
-
4
-
5
-
6
-
7
-
8
-
9
-
10
-
11
-
12
-
13
-
14
-
15
-
16
-
17
-
18
-
19
-
20
-
21
-
22
-
23
-
24
-
25
-
26
-
27
-
28
-
29
-
30
-
31
-
32
-
33
-
34
-
35
-
36
-
37
-
38
-
39
-
40
-
41
-
42
-
43
-
44
-
45
-
46
-
47
-
48
-
49
-
50
-
51
-
52
-
53
-
54
-
55
-
56
-
57
-
58
-
59
-
60
-
61
-
62
-
63
-
64
-
65
-
66
-
67
-
68
-
69
-
70
-
71
-
72
-
73
-
74
-
75
-
76
-
77
-
78
-
79
-
80
-
81
-
82
-
83
-
84
-
85
-
86
-
87
-
88
-
89
-
90
-
91
-
92
-
93
-
94
-
95
-
96
-
97
-
98
-
99
-
100
-
101
-
102
-
103
-
104
-
105
-
106
-
107
-
108
-
109
-
110
-
111
-
112
-
113
-
114
-
115
-
116
-
117
-
118
-
119
-
120
-
121
-
122
-
123
-
124
-
125
-
126
-
127
-
128
-
129
-
130
-
131
-
132
-
133
-
134
-
135
-
136
-
137
-
138
-
139
-
140
-
141
-
142
-
143
-
144
-
145
-
146
-
147
-
148
-
149
-
150
-
151
-
152
-
153
-
154
-
155
-
156
-
157
-
158
-
159
-
160
-
161
-
162
-
163
-
164
-
165
-
166
-
167
-
168
-
169
-
170
-
171
-
172
-
173
-
174
-
175
-
176
-
177
-
178
-
179
-
180
-
181
-
182
-
183
-
184
-
185
-
186
-
187
-
188
-
189
-
190
-
191
-
192
-
193
-
194
-
195
-
196
-
197
-
198
-
199
-
200
-
201
-
202
-
203
-
204
-
205
-
206
-
207
-
208
-
209
-
210
-
211
-
212
-
213
-
214
-
215
-
216
-
217
-
218
-
219
-
220
-
221
-
222
-
223
-
224
-
225
-
226
-
227
-
228
-
229
-
230
-
231
-
232
-
233
-
234
-
235
-
236
-
237
-
238
-
239
-
240
-
241
-
242
-
243
-
244
-
245
-
246
-
247
-
248
-
249
-
250
-
251
-
252
-
253
-
254
-
255
-
256
-
257
-
258
-
259
-
260
-
261
-
262
-
263
-
264
-
265
-
266
-
267
-
268
-
269
-
270
-
271
-
272
-
273
-
274
-
275
-
276
-
277
-
278
-
279
-
280
-
281
-
 282
282 -
 283
283 -
 284
284 -
 285
285 -
 286
286 -
 287
287 -
 288
288 -
 289
289 -
 290
290 -
 291
291 -
 292
292 -
 293
293 -
 294
294 -
 295
295 -
 296
296 -
 297
297 -
 298
298 -
 299
299
 |
 |

291RBS Group Annual Report and Accounts 2008
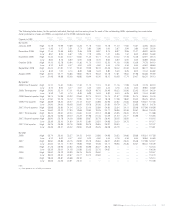
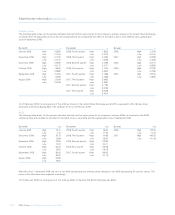
Dividend history
Preference and other non-equity dividends
2008 2007 2006 2005
Subordinated Subordinated Subordinated Subordinated
liabilities Equity liabilities Equity liabilities Equity liabilities Equity 2004
Amount per share $£$£££ £££££
Non-cumulative preference shares of US$0.01
– Series D (redeemed March 2006) —— — 0.21 1.13 1.11
– Series E (redeemed January 2007) —— 0.04 1.10 1.12 1.10
– Series F 1.91 1.04 0.96 1.03 1.06 1.04
– Series G (redeemed January 2007) —— 0.04 1.00 1.02 1.00
– Series H 1.81 0.99 0.91 0.98 1.00 0.98
– Series I (redeemed March 2006) —— — 0.20 1.10 1.08
– Series J (redeemed November 2005) —— ——1.06 1.15
– Series K (redeemed January 2007) —— 0.04 1.06 1.09 1.07
– Series L 1.44 0.78 0.72 0.78 0.79 0.19
– Series M 1.60 0.89 0.80 0.87 0.88 0.30
– Series N 1.59 0.88 0.79 0.86 0.55 —
– Series P 1.56 0.87 0.78 0.85 0.13 —
– Series Q 1.69 0.94 0.84 0.53 ——
– Series R 1.53 0.85 0.77 ———
– Series S 1.65 0.92 0.41 ———
– Series T 1.81 1.01 0.23 ———
– Series U 7,555 3,935 ————
Non-cumulative convertible preference
shares of US$0.01
– Series 1 91.18 49.66 45.58 50.26 50.33 49.05
– Series 2 (redeemed March 2005) —— ——11.60 47.43
– Series 3 (redeemed December 2005) —— ——43.03 41.74
Non-cumulative convertible preference
shares of €0.01
– Series 1 (redeemed March 2005) —— ——11.54 44.19
Non-cumulative preference shares of €0.01
– Series 1 67.95 46.53 39.63 37.18 41.14 3.45
– Series 2 61.03 41.79 35.52 36.22 ——
Non-cumulative convertible preference
shares of £0.01
– Series 1 107.88 73.87 73.87 73.87 73.87 73.87
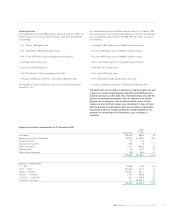
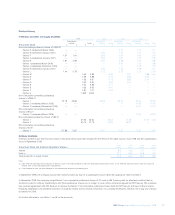
Ordinary dividends
Ordinary dividends per share for prior years in the table below have been restated for the effect of the rights issue in June 2008 and the capitalisation
issue in September 2008.
2007 2006 2005 2004
Amount per share and American Depository Shares (1) pence pence pence pence
Interim 8.5 6.8 5.4 4.7
Final (2) 19.3 18.5 14.8 11.5
Total dividends on equity shares 27.8 25.3 20.2 16.2
Notes:
(1) Each American Depository Share represents 20 ordinary shares. The historical amounts listed in the table apply to the ordinary shares, as the American Depositary Shares were not issued until
October 2007 as described above under Trading Market.
(2) Final dividends for each year were proposed in the indicated year and paid in the following year.
In September 2008, the company issued new ordinary shares by way of a capitalisation issue rather than paying an interim dividend.
In December 2008, the company issued Series 2 non-cumulative preference shares of £1 each to HM Treasury, with an attached condition that no
dividend is paid to ordinary shareholders until those preference shares are no longer in issue, unless otherwise agreed by HM Treasury. The company
has reached agreement with HM Treasury to replace the Series 2 non-cumulative preference shares held by HM Treasury with new ordinary shares.
Following redemption, the dividend restriction on ordinary shares will be removed. However, it is currently the Board’s intention not to pay any ordinary
dividends for 2009.
For further information, see Notes 7 and 8 on the accounts.