RBS 2008 Annual Report Download - page 51
Download and view the complete annual report
Please find page 51 of the 2008 RBS annual report below. You can navigate through the pages in the report by either clicking on the pages listed below, or by using the keyword search tool below to find specific information within the annual report.-
 1
1 -
2
-
3
-
4
-
5
-
6
-
7
-
8
-
9
-
10
-
11
-
12
-
13
-
14
-
15
-
16
-
17
-
18
-
19
-
20
-
21
-
22
-
23
-
24
-
25
-
26
-
27
-
28
-
29
-
30
-
31
-
32
-
33
-
34
-
35
-
36
-
37
-
38
-
39
-
40
-
 41
41 -
 42
42 -
 43
43 -
 44
44 -
 45
45 -
 46
46 -
 47
47 -
 48
48 -
 49
49 -
 50
50 -
 51
51 -
 52
52 -
 53
53 -
 54
54 -
 55
55 -
 56
56 -
 57
57 -
 58
58 -
 59
59 -
 60
60 -
 61
61 -
62
-
63
-
64
-
65
-
66
-
67
-
68
-
69
-
70
-
71
-
72
-
73
-
74
-
75
-
76
-
77
-
78
-
79
-
80
-
81
-
82
-
83
-
84
-
85
-
86
-
87
-
88
-
89
-
90
-
91
-
92
-
93
-
94
-
95
-
96
-
97
-
98
-
99
-
100
-
101
-
102
-
103
-
104
-
105
-
106
-
107
-
108
-
109
-
110
-
111
-
112
-
113
-
114
-
115
-
116
-
117
-
118
-
119
-
120
-
121
-
122
-
123
-
124
-
125
-
126
-
127
-
128
-
129
-
130
-
131
-
132
-
133
-
134
-
135
-
136
-
137
-
138
-
139
-
140
-
141
-
142
-
143
-
144
-
145
-
146
-
147
-
148
-
149
-
150
-
151
-
152
-
153
-
154
-
155
-
156
-
157
-
158
-
159
-
160
-
161
-
162
-
163
-
164
-
165
-
166
-
167
-
168
-
169
-
170
-
171
-
172
-
173
-
174
-
175
-
176
-
177
-
178
-
179
-
180
-
181
-
182
-
183
-
184
-
185
-
186
-
187
-
188
-
189
-
190
-
191
-
192
-
193
-
194
-
195
-
196
-
197
-
198
-
199
-
200
-
201
-
202
-
203
-
204
-
205
-
206
-
207
-
208
-
209
-
210
-
211
-
212
-
213
-
214
-
215
-
216
-
217
-
218
-
219
-
220
-
221
-
222
-
223
-
224
-
225
-
226
-
227
-
228
-
229
-
230
-
231
-
232
-
233
-
234
-
235
-
236
-
237
-
238
-
239
-
240
-
241
-
242
-
243
-
244
-
245
-
246
-
247
-
248
-
249
-
250
-
251
-
252
-
253
-
254
-
255
-
256
-
257
-
258
-
259
-
260
-
261
-
262
-
263
-
264
-
265
-
266
-
267
-
268
-
269
-
270
-
271
-
272
-
273
-
274
-
275
-
276
-
277
-
278
-
279
-
280
-
281
-
282
-
283
-
284
-
285
-
286
-
287
-
288
-
289
-
290
-
291
-
292
-
293
-
294
-
295
-
296
-
297
-
298
-
299
 |
 |

RBS Group Annual Report and Accounts 200850
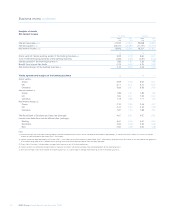
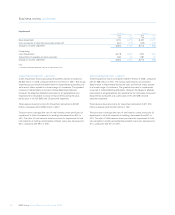
Business review continued
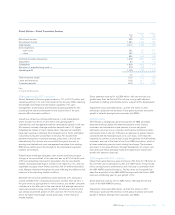
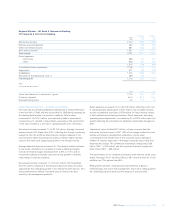
Pro forma Pro forma Statutory Statutory
2008 2007 2008 2007
£m £m £m £m
Global Markets
Global Banking & Markets (3,570) 4,641 (10,515) 3,653
Global Transaction Services 1,339 1,198 1,818 1,315
Total Global Markets (excluding credit market write-downs and one-off items) (2,231) 5,839 (8,697) 4,968
Regional Markets
UK Retail & Commercial Banking 3,283 3,985 5,679 6,225
US Retail & Commercial Banking 524 1,143 883 1,479
Europe & Middle East Retail & Commercial Banking 70 463 429 769
Asia Retail & Commercial Banking (113) (20) 127 91
Total Regional Markets 3,764 5,571 7,118 8,564
RBS Insurance 780 681 1,020 905
Group Manufacturing — —(4,793) (3,773)
Central items (excluding one-off items) (2,233) (1,777) (675) (552)
Share of shared assets — —(300) (73)
RFS Holdings minority interest — —41 163
Underlying profit/(loss) 80 10,314 (6,286) 10,202
Credit market write-downs and one-off items (6,107) (1,026) ——
Amortisation of purchased intangibles — —(443) (262)
Integration and restructuring costs — —(1,357) (108)
Write-down of goodwill and other intangible assets — —(32,581) —
Group operating (loss)/profit (6,027) 9,288 (40,667) 9,832
The performance of each of the divisions is reviewed on pages 51 to 67.
Pro forma Group operating (loss)/profit is before purchased intangibles amortisation, write-down of goodwill and other intangible assets, integration
costs, restructuring costs and RBS share of consortium shared assets.
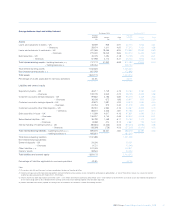
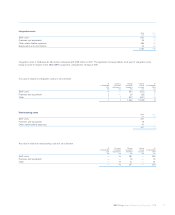
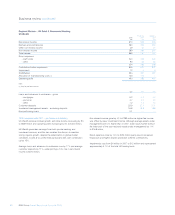
Risk-weighted assets of each division were as follows:
Basel II Basel II Basel I
31 December 1 January 31 December
2008 2008 2007
£bn £bn £bn
Global Markets
Global Banking & Markets 278.5 211.9 188.7
Global Transaction Services 19.6 16.8 15.4
Total Global Markets 298.1 228.7 204.1
Regional Markets
UK Retail & Commercial Banking 152.5 153.1 179.0
US Retail & Commercial Banking 78.0 53.8 57.1
Europe & Middle East Retail & Commercial Banking 30.9 30.3 36.7
Asia Retail & Commercial Banking 6.4 4.9 3.3
Total Regional Markets 267.8 242.1 276.1
Other 11.9 15.3 9.8
577.8 486.1 490.0
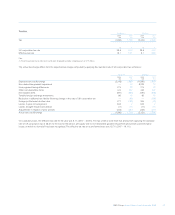
Divisional performance
The results of each division on both the statutory and pro forma basis
are set out below. The pro forma divisional results are stated before
credit market write-downs and one-off items, amortisation of purchased
intangible assets, write-down of goodwill and other intangible assets,
integration costs, restructuring costs, share of shared assets and after
allocation of manufacturing costs where appropriate (‘Group operating
profit’). The Group manages costs where they arise. Customer-facing
divisions control their direct expenses whilst Manufacturing is
responsible for shared costs. In 2008, the Group did not allocate these
shared costs between divisions in the day-to-day management of its
businesses, and the way in which divisional results are presented
reflects this. However, in order to provide a basis for market comparison,
the pro forma results below also include an allocation of Manufacturing
costs to the customer-facing divisions on a basis management
considers to be reasonable.