RBS 2008 Annual Report Download - page 124
Download and view the complete annual report
Please find page 124 of the 2008 RBS annual report below. You can navigate through the pages in the report by either clicking on the pages listed below, or by using the keyword search tool below to find specific information within the annual report.-
 1
1 -
2
-
3
-
4
-
5
-
6
-
7
-
8
-
9
-
10
-
11
-
12
-
13
-
14
-
15
-
16
-
17
-
18
-
19
-
20
-
21
-
22
-
23
-
24
-
25
-
26
-
27
-
28
-
29
-
30
-
31
-
32
-
33
-
34
-
35
-
36
-
37
-
38
-
39
-
40
-
41
-
42
-
43
-
44
-
45
-
46
-
47
-
48
-
49
-
50
-
51
-
52
-
53
-
54
-
55
-
56
-
57
-
58
-
59
-
60
-
61
-
62
-
63
-
64
-
65
-
66
-
67
-
68
-
69
-
70
-
71
-
72
-
73
-
74
-
75
-
76
-
77
-
78
-
79
-
80
-
81
-
82
-
83
-
84
-
85
-
86
-
87
-
88
-
89
-
90
-
91
-
92
-
93
-
94
-
95
-
96
-
97
-
98
-
99
-
100
-
101
-
102
-
103
-
104
-
105
-
106
-
107
-
108
-
109
-
110
-
111
-
112
-
113
-
 114
114 -
 115
115 -
 116
116 -
 117
117 -
 118
118 -
 119
119 -
 120
120 -
 121
121 -
 122
122 -
 123
123 -
 124
124 -
 125
125 -
 126
126 -
 127
127 -
 128
128 -
 129
129 -
 130
130 -
 131
131 -
 132
132 -
 133
133 -
 134
134 -
135
-
136
-
137
-
138
-
139
-
140
-
141
-
142
-
143
-
144
-
145
-
146
-
147
-
148
-
149
-
150
-
151
-
152
-
153
-
154
-
155
-
156
-
157
-
158
-
159
-
160
-
161
-
162
-
163
-
164
-
165
-
166
-
167
-
168
-
169
-
170
-
171
-
172
-
173
-
174
-
175
-
176
-
177
-
178
-
179
-
180
-
181
-
182
-
183
-
184
-
185
-
186
-
187
-
188
-
189
-
190
-
191
-
192
-
193
-
194
-
195
-
196
-
197
-
198
-
199
-
200
-
201
-
202
-
203
-
204
-
205
-
206
-
207
-
208
-
209
-
210
-
211
-
212
-
213
-
214
-
215
-
216
-
217
-
218
-
219
-
220
-
221
-
222
-
223
-
224
-
225
-
226
-
227
-
228
-
229
-
230
-
231
-
232
-
233
-
234
-
235
-
236
-
237
-
238
-
239
-
240
-
241
-
242
-
243
-
244
-
245
-
246
-
247
-
248
-
249
-
250
-
251
-
252
-
253
-
254
-
255
-
256
-
257
-
258
-
259
-
260
-
261
-
262
-
263
-
264
-
265
-
266
-
267
-
268
-
269
-
270
-
271
-
272
-
273
-
274
-
275
-
276
-
277
-
278
-
279
-
280
-
281
-
282
-
283
-
284
-
285
-
286
-
287
-
288
-
289
-
290
-
291
-
292
-
293
-
294
-
295
-
296
-
297
-
298
-
299
 |
 |

123
RBS Group Annual Report and Accounts 2008
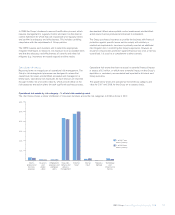
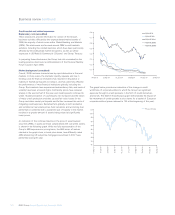
The first quarter of 2008 saw a further credit and liquidity shortages
experienced during 2007, culminating in the collapse of Bear Stearns in
March. The centre of the credit issues remained the ABS market with
worsening US economic data supporting higher levels of default
expectation in the property market. However, these default expectations
started to go beyond the sub-prime market with Alt A and other non-
conforming classes of loans particularly seeing significant price
deterioration. In addition, wider economic concerns led to heavy fair
value losses in the commercial mortgage backed securities (CMBS)
market, in corporate debt and in leveraged loan exposures. Following
this tightening of conditions, the Group incurred significant losses in
March and took steps in April to materially strengthen its capital base
through a £12 billion rights issue which was completed in June.
During the second quarter ABS prices initially rallied and steadied,
however towards the end of the quarter a negative house price trend in
the UK became clear, and in the US, market reaction to sub-prime
mortgages extended to prime and near prime lending. Corporate credit
spreads followed a similar pattern reacting to rising oil prices,
inflationary pressures and continuing high LIBOR despite base rate cuts
to 5% in April.
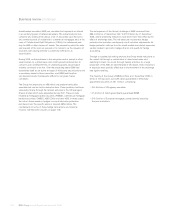
Credit spreads continued to widen across the market through the third
quarter and liquidity levels reduced further, resulting in pressure on
banks and economies worldwide. This culminated in the demise of
Lehman Brothers in September and further market consolidation and
global state intervention to provide support to the banking sector.
During the fourth quarter there was a continued lack of confidence in
the inter-bank market, with demand for stable investments resulting in
US treasuries reaching negative spreads. Corporate and ABS prices fell
further particularly in the last two months of the year increasing
pressure on banks’ capital positions. The Group moved to strengthen its
capital position through an open offer to raise £15 billion, underwritten
by the UK government. The year concluded with S&P downgrading the
credit ratings of eleven global banks, including the Group.
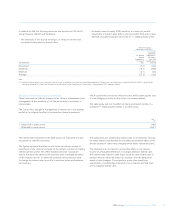
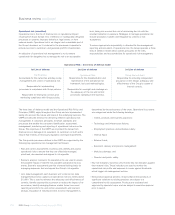
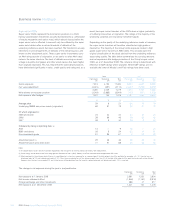
Asset-backed exposures
Significant risk concentrations (audited)
The Group’s credit markets activities gives rise to risk concentrations
that have been particularly affected by the market turmoil experienced
since the second half of 2007. The Group structures, originates,
distributes and trades debt in the form of loan, bond and derivative
instruments in all major currencies and debt capital markets in North
America, Western Europe, Asia and major emerging markets.
During 2008, certain assets identified as being high risk were also
transferred to a centrally managed asset unit, set up to provide specific
management of this portfolio of higher risk assets. Transferred assets
are predominantly ABS and associated protection purchased from
monoline insurers and other counterparties.
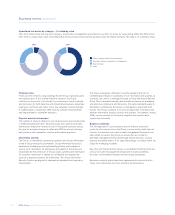
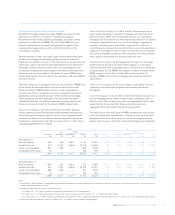
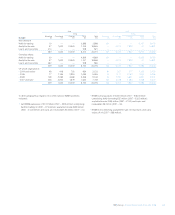
The tables below summarise the net exposures and balance sheet
carrying values of these securities by measurement classification and
references to sections with further information on specific products.
Held-for-trading Available-for-sale Loans and receivables Designated at fair value All ABS
2008 2007 2008 2007 2008 2007 2008 2007 2008 2007
Net exposure(1) £m £m £m £m £m £m £m £m £m £m
RMBS 24,462 35,105 44,450 27,875 2,578 5182 90 71,672 63,075
CMBS 1,178 2,749 918 977 1,437 626 13 47 3,546 4,399
CDOs/CLOs 2,463 7,288 2,538 2,174 1,282 ——23 6,283 9,485
Other ABS 195 3,479 6,572 5,579 3,621 72 40 186 10,428 9,316
Total 28,298 48,621 54,478 36,605 8,918 703 235 346 91,929 86,275
Carrying value(2)
RMBS 27,849 37,280 44,791 27,880 2,618 5182 90 75,440 65,255
CMBS 2,751 3,916 1,126 976 1,437 626 13 37 5,327 5,555
CDOs/CLOs 7,774 15,477 9,579 2,173 1,284 ——26 18,637 17,676
Other ABS 1,505 5,758 6,572 5,579 3,621 72 41 186 11,739 11,595
Total 39,879 62,431 62,068 36,608 8,960 703 236 339 111,143 100,081
Notes:
(1) Net exposure is carrying value after taking account of hedge protection purchased from monolines and other counterparties but excludes the effect of counterparty credit valuation adjustment.
The protection provides credit protection against the notional and interest cash flows due to the holders of debt instruments in the event of default by the debt security counterparty. The value of
the protection is based on the underlying instrument being protected.
(2) Carrying value is the amount recorded on the balance sheet.
(3) Certain instruments have been reclassified from the held-for-trading category to loans and receivables or available-for-sale categories, as permitted by the amendment to IAS 39 issued in October
2008, therefore affecting comparability by measurement classification.