RBS 2008 Annual Report Download - page 137
Download and view the complete annual report
Please find page 137 of the 2008 RBS annual report below. You can navigate through the pages in the report by either clicking on the pages listed below, or by using the keyword search tool below to find specific information within the annual report.-
 1
1 -
2
-
3
-
4
-
5
-
6
-
7
-
8
-
9
-
10
-
11
-
12
-
13
-
14
-
15
-
16
-
17
-
18
-
19
-
20
-
21
-
22
-
23
-
24
-
25
-
26
-
27
-
28
-
29
-
30
-
31
-
32
-
33
-
34
-
35
-
36
-
37
-
38
-
39
-
40
-
41
-
42
-
43
-
44
-
45
-
46
-
47
-
48
-
49
-
50
-
51
-
52
-
53
-
54
-
55
-
56
-
57
-
58
-
59
-
60
-
61
-
62
-
63
-
64
-
65
-
66
-
67
-
68
-
69
-
70
-
71
-
72
-
73
-
74
-
75
-
76
-
77
-
78
-
79
-
80
-
81
-
82
-
83
-
84
-
85
-
86
-
87
-
88
-
89
-
90
-
91
-
92
-
93
-
94
-
95
-
96
-
97
-
98
-
99
-
100
-
101
-
102
-
103
-
104
-
105
-
106
-
107
-
108
-
109
-
110
-
111
-
112
-
113
-
114
-
115
-
116
-
117
-
118
-
119
-
120
-
121
-
122
-
123
-
124
-
125
-
126
-
 127
127 -
 128
128 -
 129
129 -
 130
130 -
 131
131 -
 132
132 -
 133
133 -
 134
134 -
 135
135 -
 136
136 -
 137
137 -
 138
138 -
 139
139 -
 140
140 -
 141
141 -
 142
142 -
 143
143 -
 144
144 -
 145
145 -
 146
146 -
 147
147 -
148
-
149
-
150
-
151
-
152
-
153
-
154
-
155
-
156
-
157
-
158
-
159
-
160
-
161
-
162
-
163
-
164
-
165
-
166
-
167
-
168
-
169
-
170
-
171
-
172
-
173
-
174
-
175
-
176
-
177
-
178
-
179
-
180
-
181
-
182
-
183
-
184
-
185
-
186
-
187
-
188
-
189
-
190
-
191
-
192
-
193
-
194
-
195
-
196
-
197
-
198
-
199
-
200
-
201
-
202
-
203
-
204
-
205
-
206
-
207
-
208
-
209
-
210
-
211
-
212
-
213
-
214
-
215
-
216
-
217
-
218
-
219
-
220
-
221
-
222
-
223
-
224
-
225
-
226
-
227
-
228
-
229
-
230
-
231
-
232
-
233
-
234
-
235
-
236
-
237
-
238
-
239
-
240
-
241
-
242
-
243
-
244
-
245
-
246
-
247
-
248
-
249
-
250
-
251
-
252
-
253
-
254
-
255
-
256
-
257
-
258
-
259
-
260
-
261
-
262
-
263
-
264
-
265
-
266
-
267
-
268
-
269
-
270
-
271
-
272
-
273
-
274
-
275
-
276
-
277
-
278
-
279
-
280
-
281
-
282
-
283
-
284
-
285
-
286
-
287
-
288
-
289
-
290
-
291
-
292
-
293
-
294
-
295
-
296
-
297
-
298
-
299
 |
 |

Business review continued
RBS Group Annual Report and Accounts 2008136
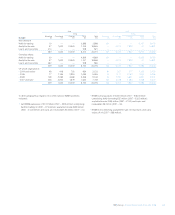
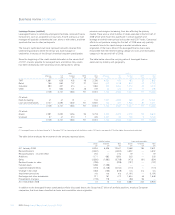
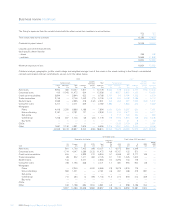
2008 2007
Notional Notional
amount Fair value Credit amount Fair value Credit
protected protected Gross valuation protected protected Gross valuation
assets assets exposure adjustment assets assets exposure adjustment
£m £m £m £m £m £m £m £m
AAA/AA rated
CDOs ————4,976 3,006 1.970 150
RMBS 321—73 73 ——
CMBS 613 496 117 51 3,731 3,421 310 34
CLOs 6,506 4,882 1,624 718 9,941 9,702 239 44
Other ABS 1,548 990 558 251 4,553 4,388 165 14
Other 267 167 100 47 622 516 106 1
8,937 6,537 2,400 1,067 23,896 21,106 2,790 243
A/BBB rated
CDO of RMBS 5,385 1,363 4,022 1,938 ————
RMBS 90 63 27 10 ————
CMBS 4,236 1,892 2,344 1,378 ————
CLOs 6,009 4,523 1,486 778 ————
Other ABS 910 433 477 243 ————
Other 265 122 143 79 ————
16,895 8,396 8,499 4,426 ————
Sub-investment grade
CDO of RMBS 394 32 362 263 918 453 465 465
RMBS ————————
CMBS ————————
CLOs 350 268 82 60 ————
Other ABS 1,208 1,037 171 123 ————
Other 237 169 68 49 154 — 154 154
2,189 1,506 683 495 1,072 453 619 619
Total
CDO of RMBS 5,779 1,395 4,384 2,201 5,894 3,459 2,435 615
RMBS 93 65 28 10 73 73 ——
CMBS 4,849 2,388 2,461 1,429 3,731 3,421 310 34
CLOs 12,865 9,673 3,192 1,556 9,941 9,702 239 44
Other ABS 3,666 2,460 1,206 617 4,553 4,388 165 14
Other 769 458 311 175 776 516 260 155
28,021 16,439 11,582 5,988 24,968 21,559 3,409 862
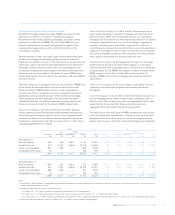
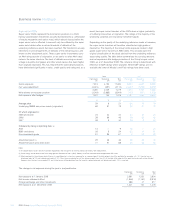
The Group also has indirect exposure through wrapped securities and assets which have an intrinsic credit enhancement from a monoline insurer.
These securities are traded with the benefit of this credit enhancement and therefore any deterioration in the credit rating of the monoline is reflected
in the market prices for these assets.
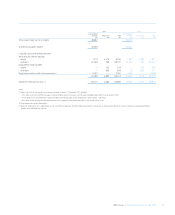
The change in CVA is analysed in the table below:
£m
At 1 January 2008 862
CVA realised in 2008 (1,737)
Net benefit on counterparty hedges 304
Foreign currency movements 1,086
Net benefit on reclassified debt securities 1,916
Net income statement effect 3,557
Balance at 31 December 2008 5,988