RBS 2008 Annual Report Download - page 194
Download and view the complete annual report
Please find page 194 of the 2008 RBS annual report below. You can navigate through the pages in the report by either clicking on the pages listed below, or by using the keyword search tool below to find specific information within the annual report.-
 1
1 -
2
-
3
-
4
-
5
-
6
-
7
-
8
-
9
-
10
-
11
-
12
-
13
-
14
-
15
-
16
-
17
-
18
-
19
-
20
-
21
-
22
-
23
-
24
-
25
-
26
-
27
-
28
-
29
-
30
-
31
-
32
-
33
-
34
-
35
-
36
-
37
-
38
-
39
-
40
-
41
-
42
-
43
-
44
-
45
-
46
-
47
-
48
-
49
-
50
-
51
-
52
-
53
-
54
-
55
-
56
-
57
-
58
-
59
-
60
-
61
-
62
-
63
-
64
-
65
-
66
-
67
-
68
-
69
-
70
-
71
-
72
-
73
-
74
-
75
-
76
-
77
-
78
-
79
-
80
-
81
-
82
-
83
-
84
-
85
-
86
-
87
-
88
-
89
-
90
-
91
-
92
-
93
-
94
-
95
-
96
-
97
-
98
-
99
-
100
-
101
-
102
-
103
-
104
-
105
-
106
-
107
-
108
-
109
-
110
-
111
-
112
-
113
-
114
-
115
-
116
-
117
-
118
-
119
-
120
-
121
-
122
-
123
-
124
-
125
-
126
-
127
-
128
-
129
-
130
-
131
-
132
-
133
-
134
-
135
-
136
-
137
-
138
-
139
-
140
-
141
-
142
-
143
-
144
-
145
-
146
-
147
-
148
-
149
-
150
-
151
-
152
-
153
-
154
-
155
-
156
-
157
-
158
-
159
-
160
-
161
-
162
-
163
-
164
-
165
-
166
-
167
-
168
-
169
-
170
-
171
-
172
-
173
-
174
-
175
-
176
-
177
-
178
-
179
-
180
-
181
-
182
-
183
-
 184
184 -
 185
185 -
 186
186 -
 187
187 -
 188
188 -
 189
189 -
 190
190 -
 191
191 -
 192
192 -
 193
193 -
 194
194 -
 195
195 -
 196
196 -
 197
197 -
 198
198 -
 199
199 -
 200
200 -
 201
201 -
 202
202 -
 203
203 -
 204
204 -
205
-
206
-
207
-
208
-
209
-
210
-
211
-
212
-
213
-
214
-
215
-
216
-
217
-
218
-
219
-
220
-
221
-
222
-
223
-
224
-
225
-
226
-
227
-
228
-
229
-
230
-
231
-
232
-
233
-
234
-
235
-
236
-
237
-
238
-
239
-
240
-
241
-
242
-
243
-
244
-
245
-
246
-
247
-
248
-
249
-
250
-
251
-
252
-
253
-
254
-
255
-
256
-
257
-
258
-
259
-
260
-
261
-
262
-
263
-
264
-
265
-
266
-
267
-
268
-
269
-
270
-
271
-
272
-
273
-
274
-
275
-
276
-
277
-
278
-
279
-
280
-
281
-
282
-
283
-
284
-
285
-
286
-
287
-
288
-
289
-
290
-
291
-
292
-
293
-
294
-
295
-
296
-
297
-
298
-
299
 |
 |

193RBS Group Annual Report and Accounts 2008
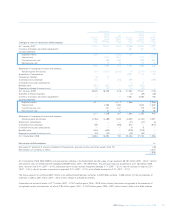
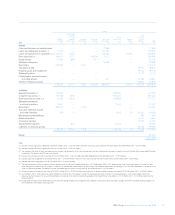
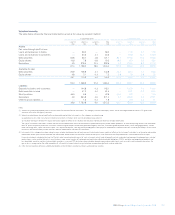
Main scheme All schemes
Present Present
value of Net value of Net
Fair value defined pension Fair value defined pension
of plan benefit deficit/ of plan benefit deficit/
assets obligations (surplus) assets obligations (surplus)
Changes in value of net pension deficit/(surplus) £m £m £m £m £m £m
At 1 January 2007 17,374 19,004 1,630 18,959 20,951 1,992
Currency translation and other adjustments ———381 397 16
Income statement:
Expected return 1,182 (1,182) 1,394 (1,394)
Interest cost 1,007 1,007 1,177 1,177
Current service cost 566 566 684 684
Past service cost 19 19 22 22
1,182 1,592 410 1,394 1,883 489
Statement of recognised income and expense:
Actuarial gains and losses 163 (1,937) (2,100) 19 (2,170) (2,189)
Acquisition of subsidiaries ———6,997 7,173 176
Intra-group transfers 30 30 ————
Contributions by employer 416 — (416) 599 — (599)
Contributions by plan participants ——— 5 5—
Benefits paid (551) (551) — (652) (652) —
Expenses included in service cost (39) (39) — (40) (40) —
At 1 January 2008 18,575 18,099 (476) 27,662 27,547 (115)
Transfers to disposal groups ———(1) (49) (48)
Currency translation and other adjustments ———2,497 2,692 195
Income statement:
Expected return 1,271 (1,271) 1,865 (1,865)
Interest cost 1,080 1,080 1,622 1,622
Current service cost 437 437 705 705
Past service cost 21 21 28 28
1,271 1,538 267 1,865 2,355 490
Statement of recognised income and expense:
Actuarial gains and losses (4,784) (3,389) 1,395 (6,051) (3,764) 2,287
Disposal of subsidiaries ———(31) (34) (3)
Contributions by employer 396 — (396) 810 — (810)
Contributions by plan participants ——— 9 9—
Benefits paid (630) (630) — (978) (978) —
Expenses included in service cost (24) (24) — (26) (26) —
At 31 December 2008 14,804 15,594 790 25,756 27,752 1,996
Net pension deficit comprises: £m
Net assets of schemes in surplus (included in Prepayments, accrued income and other assets, Note 19) (36)
Net liabilities of schemes in deficit 2,032
1,996
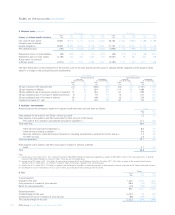
At 31 December 2008, ABN AMRO’s principal pension scheme in the Netherlands had fair value of plan assets of £8,181 million (2007 – £6,417 million)
and present value of defined benefit obligations £8,589 million (2007 – £6,189 million). The principal actuarial assumptions at 31 December 2008
were: discount rate 5.4% (2007 – 5.4%); expected return on plan assets (weighted average) 4.7% (2007 – 6.2%); rate of increase in salaries 2.5%
(2007 – 2.5%); rate of increase in pensions in payment 2.0% (2007 – 2.0%); and inflation assumption 2.0% (2007 – 2.0%).
The Group expects to contribute £807 million to its defined benefit pension schemes in 2009 (Main scheme – £385 million). Of the net liabilities of
schemes in deficit, £201 million (2007 – £212 million) relates to unfunded schemes.
Cumulative net actuarial losses of £717 million (2007 – £1,570 million gains; 2006 – £619 million losses) have been recognised in the statement of
recognised income and expense, of which £184 million gains (2007 – £1,579 million gains; 2006 – £521 million losses) relate to the Main scheme.