RBS 2008 Annual Report Download - page 43
Download and view the complete annual report
Please find page 43 of the 2008 RBS annual report below. You can navigate through the pages in the report by either clicking on the pages listed below, or by using the keyword search tool below to find specific information within the annual report.-
 1
1 -
2
-
3
-
4
-
5
-
6
-
7
-
8
-
9
-
10
-
11
-
12
-
13
-
14
-
15
-
16
-
17
-
18
-
19
-
20
-
21
-
22
-
23
-
24
-
25
-
26
-
27
-
28
-
29
-
30
-
31
-
32
-
 33
33 -
 34
34 -
 35
35 -
 36
36 -
 37
37 -
 38
38 -
 39
39 -
 40
40 -
 41
41 -
 42
42 -
 43
43 -
 44
44 -
 45
45 -
 46
46 -
 47
47 -
 48
48 -
 49
49 -
 50
50 -
 51
51 -
 52
52 -
 53
53 -
54
-
55
-
56
-
57
-
58
-
59
-
60
-
61
-
62
-
63
-
64
-
65
-
66
-
67
-
68
-
69
-
70
-
71
-
72
-
73
-
74
-
75
-
76
-
77
-
78
-
79
-
80
-
81
-
82
-
83
-
84
-
85
-
86
-
87
-
88
-
89
-
90
-
91
-
92
-
93
-
94
-
95
-
96
-
97
-
98
-
99
-
100
-
101
-
102
-
103
-
104
-
105
-
106
-
107
-
108
-
109
-
110
-
111
-
112
-
113
-
114
-
115
-
116
-
117
-
118
-
119
-
120
-
121
-
122
-
123
-
124
-
125
-
126
-
127
-
128
-
129
-
130
-
131
-
132
-
133
-
134
-
135
-
136
-
137
-
138
-
139
-
140
-
141
-
142
-
143
-
144
-
145
-
146
-
147
-
148
-
149
-
150
-
151
-
152
-
153
-
154
-
155
-
156
-
157
-
158
-
159
-
160
-
161
-
162
-
163
-
164
-
165
-
166
-
167
-
168
-
169
-
170
-
171
-
172
-
173
-
174
-
175
-
176
-
177
-
178
-
179
-
180
-
181
-
182
-
183
-
184
-
185
-
186
-
187
-
188
-
189
-
190
-
191
-
192
-
193
-
194
-
195
-
196
-
197
-
198
-
199
-
200
-
201
-
202
-
203
-
204
-
205
-
206
-
207
-
208
-
209
-
210
-
211
-
212
-
213
-
214
-
215
-
216
-
217
-
218
-
219
-
220
-
221
-
222
-
223
-
224
-
225
-
226
-
227
-
228
-
229
-
230
-
231
-
232
-
233
-
234
-
235
-
236
-
237
-
238
-
239
-
240
-
241
-
242
-
243
-
244
-
245
-
246
-
247
-
248
-
249
-
250
-
251
-
252
-
253
-
254
-
255
-
256
-
257
-
258
-
259
-
260
-
261
-
262
-
263
-
264
-
265
-
266
-
267
-
268
-
269
-
270
-
271
-
272
-
273
-
274
-
275
-
276
-
277
-
278
-
279
-
280
-
281
-
282
-
283
-
284
-
285
-
286
-
287
-
288
-
289
-
290
-
291
-
292
-
293
-
294
-
295
-
296
-
297
-
298
-
299
 |
 |

RBS Group Annual Report and Accounts 200842
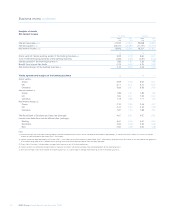
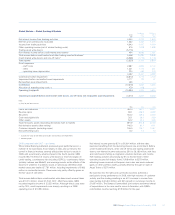
Business review continued
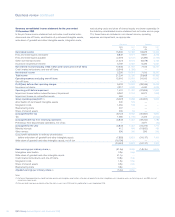
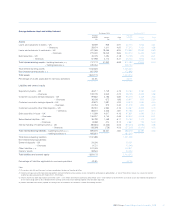
Average balance sheet and related interest
Statutory 2008 Statutory 2007
Average Average
balance Interest Rate balance Interest Rate
£m £m % £m £m %
Assets
Loans and advances to banks – UK 18,909 943 4.99 20,999 1,028 4.90
– Overseas 31,680 1,465 4.62 12,651 546 4.32
Loans and advances to customers – UK 321,066 19,066 5.94 269,460 18,541 6.88
– Overseas 393,724 22,893 5.81 175,914 10,106 5.74
Debt securities – UK 35,725 1,493 4.18 14,554 914 6.28
– Overseas 86,090 4,078 4.74 31,879 1,515 4.75
Total interest-earning assets – banking business (2, 3) 887,194 49,938 5.63 525,457 32,650 6.21
– trading business (4) 425,454 313,110
Total interest-earning assets 1,312,648 838,567
Non-interest-earning assets (2, 3) 728,037 284,405
Total assets 2,040,685 1,122,972
Percentage of assets applicable to overseas operations 48.6% 38.0%
Liabilities and owners’ equity
Deposits by banks – UK 46,217 1,804 3.90 52,951 2,234 4.22
– Overseas 113,592 4,772 4.20 31,073 1,170 3.77
Customer accounts: demand deposits – UK 99,852 2,829 2.83 93,764 3,296 3.52
– Overseas 70,399 1,512 2.15 30,739 1,035 3.37
Customer accounts: savings deposits – UK 42,870 1,708 3.98 36,334 1,658 4.56
– Overseas 72,473 2,203 3.04 27,645 902 3.26
Customer accounts: other time deposits – UK 95,181 4,011 4.21 88,702 4,202 4.74
– Overseas 106,306 4,097 3.85 43,913 2,099 4.78
Debt securities in issue – UK 111,099 4,617 4.16 67,310 3,582 5.32
– Overseas 138,297 6,171 4.46 49,848 2,627 5.27
Subordinated liabilities – UK 26,799 1,369 5.11 23,752 1,312 5.52
– Overseas 13,019 788 6.05 4,509 230 5.10
Internal funding of trading business – UK (85,664) (3,445) 4.02 (68,395) (3,307) 4.84
– Overseas (18,090) (729) 4.03 (7,454) (321) 4.31
Total interest-bearing liabilities – banking business (2, 3) 832,350 31,707 3.81 474,691 20,719 4.36
– trading business (4) 466,610 316,453
Total interest-bearing liabilities 1,298,960 791,144
Non-interest-bearing liabilities:
Demand deposits – UK 27,700 18,416
– Overseas 9,721 14,455
Other liabilities (3, 4) 645,760 255,598
Owners’ equity 58,544 43,359
Total liabilities and owners’ equity 2,040,685 1,122,972
Percentage of liabilities applicable to overseas operations 46.8% 35.9%
Notes:
(1) The analysis into UK and Overseas has been compiled on the basis of location of office.
(2) Interest-earning assets and interest-bearing liabilities exclude the Retail bancassurance assets and liabilities attributable to policyholders, in view of their distinct nature. As a result, net interest
income has been adjusted by £84 million (2007 – £85 million).
(3) Interest income has been adjusted by £332 million (2007 – £313 million) and interest expense by £860 million (2007 – £536 million) to record interest on financial assets and liabilities designated as
at fair value through profit or loss. Related interest-earning assets and interest-bearing liabilities have also been adjusted.
(4) Interest receivable and interest payable on trading assets and liabilities are included in income from trading activities.