RBS 2008 Annual Report Download - page 94
Download and view the complete annual report
Please find page 94 of the 2008 RBS annual report below. You can navigate through the pages in the report by either clicking on the pages listed below, or by using the keyword search tool below to find specific information within the annual report.-
 1
1 -
2
-
3
-
4
-
5
-
6
-
7
-
8
-
9
-
10
-
11
-
12
-
13
-
14
-
15
-
16
-
17
-
18
-
19
-
20
-
21
-
22
-
23
-
24
-
25
-
26
-
27
-
28
-
29
-
30
-
31
-
32
-
33
-
34
-
35
-
36
-
37
-
38
-
39
-
40
-
41
-
42
-
43
-
44
-
45
-
46
-
47
-
48
-
49
-
50
-
51
-
52
-
53
-
54
-
55
-
56
-
57
-
58
-
59
-
60
-
61
-
62
-
63
-
64
-
65
-
66
-
67
-
68
-
69
-
70
-
71
-
72
-
73
-
74
-
75
-
76
-
77
-
78
-
79
-
80
-
81
-
82
-
83
-
 84
84 -
 85
85 -
 86
86 -
 87
87 -
 88
88 -
 89
89 -
 90
90 -
 91
91 -
 92
92 -
 93
93 -
 94
94 -
 95
95 -
 96
96 -
 97
97 -
 98
98 -
 99
99 -
 100
100 -
 101
101 -
 102
102 -
 103
103 -
 104
104 -
105
-
106
-
107
-
108
-
109
-
110
-
111
-
112
-
113
-
114
-
115
-
116
-
117
-
118
-
119
-
120
-
121
-
122
-
123
-
124
-
125
-
126
-
127
-
128
-
129
-
130
-
131
-
132
-
133
-
134
-
135
-
136
-
137
-
138
-
139
-
140
-
141
-
142
-
143
-
144
-
145
-
146
-
147
-
148
-
149
-
150
-
151
-
152
-
153
-
154
-
155
-
156
-
157
-
158
-
159
-
160
-
161
-
162
-
163
-
164
-
165
-
166
-
167
-
168
-
169
-
170
-
171
-
172
-
173
-
174
-
175
-
176
-
177
-
178
-
179
-
180
-
181
-
182
-
183
-
184
-
185
-
186
-
187
-
188
-
189
-
190
-
191
-
192
-
193
-
194
-
195
-
196
-
197
-
198
-
199
-
200
-
201
-
202
-
203
-
204
-
205
-
206
-
207
-
208
-
209
-
210
-
211
-
212
-
213
-
214
-
215
-
216
-
217
-
218
-
219
-
220
-
221
-
222
-
223
-
224
-
225
-
226
-
227
-
228
-
229
-
230
-
231
-
232
-
233
-
234
-
235
-
236
-
237
-
238
-
239
-
240
-
241
-
242
-
243
-
244
-
245
-
246
-
247
-
248
-
249
-
250
-
251
-
252
-
253
-
254
-
255
-
256
-
257
-
258
-
259
-
260
-
261
-
262
-
263
-
264
-
265
-
266
-
267
-
268
-
269
-
270
-
271
-
272
-
273
-
274
-
275
-
276
-
277
-
278
-
279
-
280
-
281
-
282
-
283
-
284
-
285
-
286
-
287
-
288
-
289
-
290
-
291
-
292
-
293
-
294
-
295
-
296
-
297
-
298
-
299
 |
 |

93RBS Group Annual Report and Accounts 2008
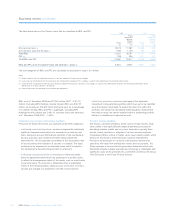
Corporate sectors (unaudited)
This section discusses the automotive, shipping, oil and gas sectors,
given their significance in the current market environment.
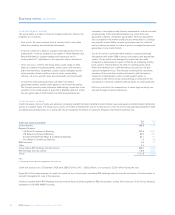
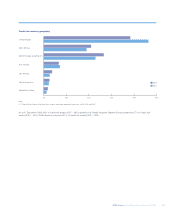
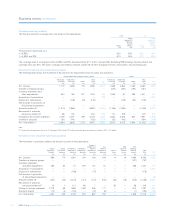
Automotive
The automotive sector exposure totals £14.5 billion, the majority falling
within GBM (£9.1 billion), RBS UK (£3.3 billion) and CFG (£1.3 billion).
The exposure is spread across the following segments and
geographies:
Credit book
Segment £bn %
Original equipment manufacturer/commercial vehicles 3.3 23
Captive finance companies 1.1 8
Component suppliers 2.4 16
Retailers/services 5.1 35
Rental 2.6 18
Total 14.5 100
Credit book
Domicile £bn %
Americas 4.0 28
Central Eastern Europe
Middle East and Africa 1.1 7
UK 4.2 29
Western Europe 4.3 30
Asia 0.9 6
Total 14.5 100
The automotive sector faces numerous challenges with a heavy reliance
on discretionary consumer spending, high leverage, volatile input prices
and an ongoing pressure to reduce fuel emissions resulting in a shift to
smaller cars and overseas production. The Group has maintained a
cautious approach to this sector and focus on the largest, most
diversified and financially strong counterparties with a wide product
offering. Notwithstanding this approach, due to the scale of the
downturn in this sector the Group can expect further pressure to be
seen across the portfolio. Of particular concern are exposures to the
captive finance companies where credit impaired limits total £1.4 billion.
The Group continues to seek ongoing limit reductions and improved
security.
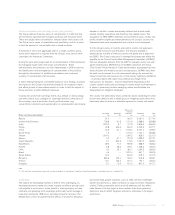
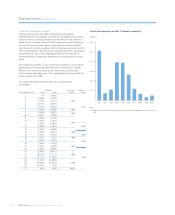
Shipping
The shipping exposure is £16.6 billion and is almost entirely within
GBM. The portfolio is divided across the following sectors:
Credit book
Sector £bn %
Dry bulk 4.8 29
Tankers 6.3 38
Container 1.6 10
Gas/offshore 2.3 14
Other 1.6 9
Total 16.6 100
The majority of the exposures are strong relationships with loans
structured to capture direct vessel cash flows, secured on the vessels
themselves with the benefit of full security over the asset and all related
cash flows. The Group’s approach to the sector recognises the cyclical
nature of shipping with a focus on experienced independent owners
with strong liquidity; customer deposits across the portfolio total £5
billion. Assets financed are non-specialist dry bulk, double hulled
tankers and containers.
Following an unprecedented rise in ship values over recent years there
has been a material correction since mid 2008 with the dry bulk index
falling by c.90% which may affect owners’ ability to meet collateral calls.
Combined with record ship deliveries for 2009-10 the Group has seen a
significant decline in asset values. The Group’s exposure to new build
assets is significant with commitments relating to 236 vessels in the dry
bulk and tanker segment.
The Group currently has £0.5 billion of limits to clients on watch list, but
the portfolio comprises modern assets (86% of exposures are secured
on vessels built since 2000), which exhibit, for the most part, good cash
flow and liquidity.
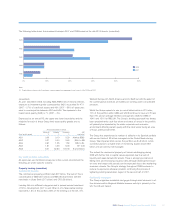
Oil and gas
The Group’s exposure to this sector totals £24.0 billion across the
following sectors and geographies:
Credit book
Sector £bn %
Vertically integrate/exploration and production 9.5 40
Midstream 5.0 21
Refining and marketing 4.6 19
Oilfield services 4.9 20
Total 24.0 100
Credit book
Domicile £bn %
Americas 10.6 44
Western Europe 7.6 32
CEEMEA 4.6 19
Asia Pacific 1.2 5
Total 24.0 100
ABN AMRO and RBS have a number of common clients in this sector,
and the Group is working to reduce exposures back within Group
concentration limits, primarily in relation to investment grade, vertically
integrated counterparties and several of the larger, global exploration
and production companies. The Group’s exposures to exploration and
production companies are principally secured borrowing base facilities
referenced to conservative forward looking oil price assumptions that
are adjusted on a regular basis. Unsecured exposures are primarily to
oil majors and state owned entities.