RBS 2008 Annual Report Download - page 59
Download and view the complete annual report
Please find page 59 of the 2008 RBS annual report below. You can navigate through the pages in the report by either clicking on the pages listed below, or by using the keyword search tool below to find specific information within the annual report.-
 1
1 -
2
-
3
-
4
-
5
-
6
-
7
-
8
-
9
-
10
-
11
-
12
-
13
-
14
-
15
-
16
-
17
-
18
-
19
-
20
-
21
-
22
-
23
-
24
-
25
-
26
-
27
-
28
-
29
-
30
-
31
-
32
-
33
-
34
-
35
-
36
-
37
-
38
-
39
-
40
-
41
-
42
-
43
-
44
-
45
-
46
-
47
-
48
-
 49
49 -
 50
50 -
 51
51 -
 52
52 -
 53
53 -
 54
54 -
 55
55 -
 56
56 -
 57
57 -
 58
58 -
 59
59 -
 60
60 -
 61
61 -
 62
62 -
 63
63 -
 64
64 -
 65
65 -
 66
66 -
 67
67 -
 68
68 -
 69
69 -
70
-
71
-
72
-
73
-
74
-
75
-
76
-
77
-
78
-
79
-
80
-
81
-
82
-
83
-
84
-
85
-
86
-
87
-
88
-
89
-
90
-
91
-
92
-
93
-
94
-
95
-
96
-
97
-
98
-
99
-
100
-
101
-
102
-
103
-
104
-
105
-
106
-
107
-
108
-
109
-
110
-
111
-
112
-
113
-
114
-
115
-
116
-
117
-
118
-
119
-
120
-
121
-
122
-
123
-
124
-
125
-
126
-
127
-
128
-
129
-
130
-
131
-
132
-
133
-
134
-
135
-
136
-
137
-
138
-
139
-
140
-
141
-
142
-
143
-
144
-
145
-
146
-
147
-
148
-
149
-
150
-
151
-
152
-
153
-
154
-
155
-
156
-
157
-
158
-
159
-
160
-
161
-
162
-
163
-
164
-
165
-
166
-
167
-
168
-
169
-
170
-
171
-
172
-
173
-
174
-
175
-
176
-
177
-
178
-
179
-
180
-
181
-
182
-
183
-
184
-
185
-
186
-
187
-
188
-
189
-
190
-
191
-
192
-
193
-
194
-
195
-
196
-
197
-
198
-
199
-
200
-
201
-
202
-
203
-
204
-
205
-
206
-
207
-
208
-
209
-
210
-
211
-
212
-
213
-
214
-
215
-
216
-
217
-
218
-
219
-
220
-
221
-
222
-
223
-
224
-
225
-
226
-
227
-
228
-
229
-
230
-
231
-
232
-
233
-
234
-
235
-
236
-
237
-
238
-
239
-
240
-
241
-
242
-
243
-
244
-
245
-
246
-
247
-
248
-
249
-
250
-
251
-
252
-
253
-
254
-
255
-
256
-
257
-
258
-
259
-
260
-
261
-
262
-
263
-
264
-
265
-
266
-
267
-
268
-
269
-
270
-
271
-
272
-
273
-
274
-
275
-
276
-
277
-
278
-
279
-
280
-
281
-
282
-
283
-
284
-
285
-
286
-
287
-
288
-
289
-
290
-
291
-
292
-
293
-
294
-
295
-
296
-
297
-
298
-
299
 |
 |

RBS Group Annual Report and Accounts 200858
Business review continued
2008 compared with 2007 – pro forma and statutory
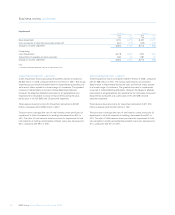
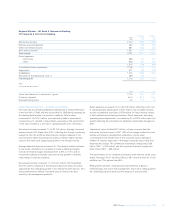
UK Wealth delivered robust growth, with total income increasing by 9%
to £859 million and operating profit increasing by 5% to £403 million.
UK Wealth generates earnings from both private banking and
investment services, and this has enabled the division to maintain
strong organic growth, despite the deterioration in global market
conditions. Coutts & Co. performed particularly well, with contribution
up by 15%.
Average loans and advances to customers rose by 17% and average
customer deposits by 11%, underpinning a 13% rise in net interest
income to £570 million.
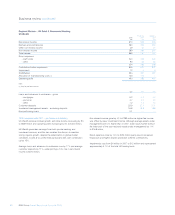
Non interest income grew by 3% to £289 million as higher fee income
was offset by lower investment income. Although average assets under
management were 4% higher than in 2007, lower stock market levels in
the latter part of the year reduced assets under management by 11%
to £16.8 billion.
Direct expenses rose by 13% to £324 million partly due to increased
headcount and higher deposit protection scheme contributions.
Impairments rose from £4 million in 2007 to £12 million and represented
approximately 0.1% of the total UK lending book.
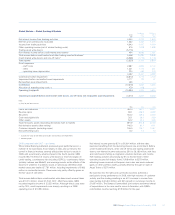
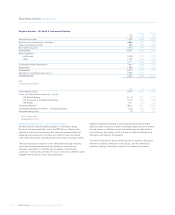
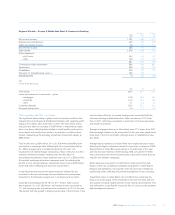
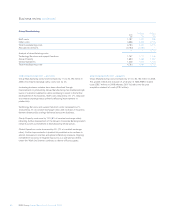
Regional Markets – UK Retail & Commercial Banking
UK Wealth
Pro forma Statutory
2008 2007 2007
£m £m £m
Net interest income 570 506 506
Net fees and commissions 250 254 254
Other non-interest income 39 27 27
Non-interest income 289 281 281
Total income 859 787 787
Direct expenses
– staff costs 234 222 222
– other 90 64 64
324 286 286
Contribution before impairment 535 501 501
Impairment 12 44
Contribution 523 497 497
Allocation of manufacturing costs (1) 120 112 —
Operating profit 403 385 497
Note:
(1) Only for pro forma results.
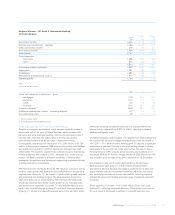
£bn £bn £bn
Loans and advances to customers – gross
– mortgages 5.2 4.2 4.2
– personal 3.7 3.0 3.0
– other 1.2 1.2 1.2
Customer deposits 25.9 27.1 27.1
Investment management assets – excluding deposits 16.8 18.8 18.8
Non-performing loans 0.1 ——