RBS 2008 Annual Report Download - page 91
Download and view the complete annual report
Please find page 91 of the 2008 RBS annual report below. You can navigate through the pages in the report by either clicking on the pages listed below, or by using the keyword search tool below to find specific information within the annual report.-
 1
1 -
2
-
3
-
4
-
5
-
6
-
7
-
8
-
9
-
10
-
11
-
12
-
13
-
14
-
15
-
16
-
17
-
18
-
19
-
20
-
21
-
22
-
23
-
24
-
25
-
26
-
27
-
28
-
29
-
30
-
31
-
32
-
33
-
34
-
35
-
36
-
37
-
38
-
39
-
40
-
41
-
42
-
43
-
44
-
45
-
46
-
47
-
48
-
49
-
50
-
51
-
52
-
53
-
54
-
55
-
56
-
57
-
58
-
59
-
60
-
61
-
62
-
63
-
64
-
65
-
66
-
67
-
68
-
69
-
70
-
71
-
72
-
73
-
74
-
75
-
76
-
77
-
78
-
79
-
80
-
 81
81 -
 82
82 -
 83
83 -
 84
84 -
 85
85 -
 86
86 -
 87
87 -
 88
88 -
 89
89 -
 90
90 -
 91
91 -
 92
92 -
 93
93 -
 94
94 -
 95
95 -
 96
96 -
 97
97 -
 98
98 -
 99
99 -
 100
100 -
 101
101 -
102
-
103
-
104
-
105
-
106
-
107
-
108
-
109
-
110
-
111
-
112
-
113
-
114
-
115
-
116
-
117
-
118
-
119
-
120
-
121
-
122
-
123
-
124
-
125
-
126
-
127
-
128
-
129
-
130
-
131
-
132
-
133
-
134
-
135
-
136
-
137
-
138
-
139
-
140
-
141
-
142
-
143
-
144
-
145
-
146
-
147
-
148
-
149
-
150
-
151
-
152
-
153
-
154
-
155
-
156
-
157
-
158
-
159
-
160
-
161
-
162
-
163
-
164
-
165
-
166
-
167
-
168
-
169
-
170
-
171
-
172
-
173
-
174
-
175
-
176
-
177
-
178
-
179
-
180
-
181
-
182
-
183
-
184
-
185
-
186
-
187
-
188
-
189
-
190
-
191
-
192
-
193
-
194
-
195
-
196
-
197
-
198
-
199
-
200
-
201
-
202
-
203
-
204
-
205
-
206
-
207
-
208
-
209
-
210
-
211
-
212
-
213
-
214
-
215
-
216
-
217
-
218
-
219
-
220
-
221
-
222
-
223
-
224
-
225
-
226
-
227
-
228
-
229
-
230
-
231
-
232
-
233
-
234
-
235
-
236
-
237
-
238
-
239
-
240
-
241
-
242
-
243
-
244
-
245
-
246
-
247
-
248
-
249
-
250
-
251
-
252
-
253
-
254
-
255
-
256
-
257
-
258
-
259
-
260
-
261
-
262
-
263
-
264
-
265
-
266
-
267
-
268
-
269
-
270
-
271
-
272
-
273
-
274
-
275
-
276
-
277
-
278
-
279
-
280
-
281
-
282
-
283
-
284
-
285
-
286
-
287
-
288
-
289
-
290
-
291
-
292
-
293
-
294
-
295
-
296
-
297
-
298
-
299
 |
 |

90
Business review continued
RBS Group Annual Report and Accounts 2008
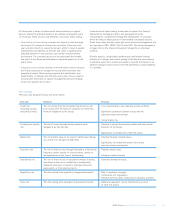
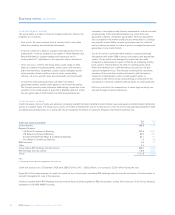
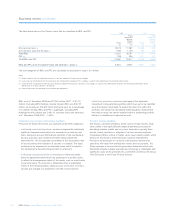
Credit risk asset quality (audited)
Internal reporting and oversight of risk assets is principally
differentiated by credit grades. Customers are assigned credit grades,
based on various credit grading models that reflect the key drivers of
default for the customer type. All credit grades across the Group map
to both a Group level asset quality scale, used for external financial
reporting, and a master grading scale for wholesale exposures used for
internal management reporting across disparate portfolios. Accordingly,
measurement of risk is easily aggregated and can be reported at
increasing levels of granularity depending on audience and business
need.
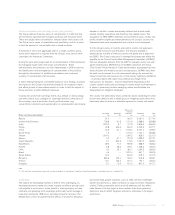
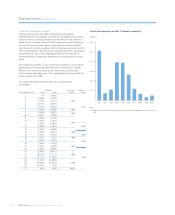
The Group has adopted, as part of the move to Basel II, a new master
grading scale for wholesale exposures which comprises 27 grades.
These in turn map to ten asset quality (AQ) bands used for both
wholesale and retail exposures. This replaced the less granular AQ1-5
bands used prior to 2008.
The relationship between these measures is shown below.
(unaudited)
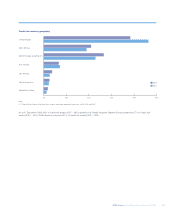
Credit risk assets by new AQ1-10 bands (unaudited)
PD Range New AQ1- Old AQ1-5
Master grading scale Lower Upper 10 bands bands
1 0% 0.006%
2 0.006% 0.012%
3 0.012% 0.017% AQ1
4 0.017% 0.024%
5 0.024% 0.034% AQ1
6 0.034% 0.048% AQ2
7 0.048% 0.067% AQ3
8 0.067% 0.095%
9 0.095% 0.135%
10 0.135% 0.190% AQ4
11 0.190% 0.269%
12 0.269% 0.381% AQ2
13 0.381% 0.538%
14 0.538% 0.761% AQ5
15 0.761% 1.076% AQ3
16 1.076% 1.522% AQ6
17 1.522% 2.153% AQ4
18 2.153% 3.044%
19 3.044% 4.305% AQ7
20 4.305% 6.089%
21 6.089% 8.611%
22 8.611% 12.177% AQ8
23 12.177% 17.222% AQ5
24 17.222% 24.355%
25 24.355% 34.443% AQ9
26 34.443% 100%
27 100% 100% AQ10
5%
10%
15%
20%
25%
30%
TCRE (%)
AQ1 AQ2 AQ3 AQ4 AQ5 AQ6 AQ7 AQ8 AQ9 AQ10
Note:
(1) Graph data are shown net of provisions, reverse repurchase agreements and issuer risk for
2008.