RBS 2008 Annual Report Download - page 226
Download and view the complete annual report
Please find page 226 of the 2008 RBS annual report below. You can navigate through the pages in the report by either clicking on the pages listed below, or by using the keyword search tool below to find specific information within the annual report.-
 1
1 -
2
-
3
-
4
-
5
-
6
-
7
-
8
-
9
-
10
-
11
-
12
-
13
-
14
-
15
-
16
-
17
-
18
-
19
-
20
-
21
-
22
-
23
-
24
-
25
-
26
-
27
-
28
-
29
-
30
-
31
-
32
-
33
-
34
-
35
-
36
-
37
-
38
-
39
-
40
-
41
-
42
-
43
-
44
-
45
-
46
-
47
-
48
-
49
-
50
-
51
-
52
-
53
-
54
-
55
-
56
-
57
-
58
-
59
-
60
-
61
-
62
-
63
-
64
-
65
-
66
-
67
-
68
-
69
-
70
-
71
-
72
-
73
-
74
-
75
-
76
-
77
-
78
-
79
-
80
-
81
-
82
-
83
-
84
-
85
-
86
-
87
-
88
-
89
-
90
-
91
-
92
-
93
-
94
-
95
-
96
-
97
-
98
-
99
-
100
-
101
-
102
-
103
-
104
-
105
-
106
-
107
-
108
-
109
-
110
-
111
-
112
-
113
-
114
-
115
-
116
-
117
-
118
-
119
-
120
-
121
-
122
-
123
-
124
-
125
-
126
-
127
-
128
-
129
-
130
-
131
-
132
-
133
-
134
-
135
-
136
-
137
-
138
-
139
-
140
-
141
-
142
-
143
-
144
-
145
-
146
-
147
-
148
-
149
-
150
-
151
-
152
-
153
-
154
-
155
-
156
-
157
-
158
-
159
-
160
-
161
-
162
-
163
-
164
-
165
-
166
-
167
-
168
-
169
-
170
-
171
-
172
-
173
-
174
-
175
-
176
-
177
-
178
-
179
-
180
-
181
-
182
-
183
-
184
-
185
-
186
-
187
-
188
-
189
-
190
-
191
-
192
-
193
-
194
-
195
-
196
-
197
-
198
-
199
-
200
-
201
-
202
-
203
-
204
-
205
-
206
-
207
-
208
-
209
-
210
-
211
-
212
-
213
-
214
-
215
-
 216
216 -
 217
217 -
 218
218 -
 219
219 -
 220
220 -
 221
221 -
 222
222 -
 223
223 -
 224
224 -
 225
225 -
 226
226 -
 227
227 -
 228
228 -
 229
229 -
 230
230 -
 231
231 -
 232
232 -
 233
233 -
 234
234 -
 235
235 -
 236
236 -
237
-
238
-
239
-
240
-
241
-
242
-
243
-
244
-
245
-
246
-
247
-
248
-
249
-
250
-
251
-
252
-
253
-
254
-
255
-
256
-
257
-
258
-
259
-
260
-
261
-
262
-
263
-
264
-
265
-
266
-
267
-
268
-
269
-
270
-
271
-
272
-
273
-
274
-
275
-
276
-
277
-
278
-
279
-
280
-
281
-
282
-
283
-
284
-
285
-
286
-
287
-
288
-
289
-
290
-
291
-
292
-
293
-
294
-
295
-
296
-
297
-
298
-
299
 |
 |

225RBS Group Annual Report and Accounts 2008
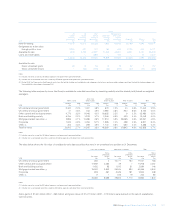
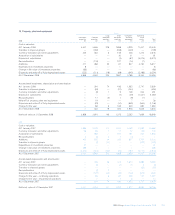
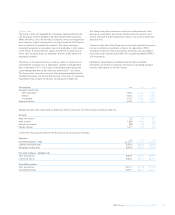
20 Discontinued operations and assets and liabilities of disposal groups
(a) Profit/(loss) from discontinued operations, net of tax
2008 2007
£m £m
Discontinued operations:
Total income 2,571 749
Operating expenses (1,407) (493)
Insurance net claims — (28)
Impairment losses (564) (160)
Profit before tax 600 68
Gain on disposal 3,859 —
Operating profit before tax 4,459 68
Tax on profit (204) (8)
Tax on gain on disposal (33) —
Profit after tax 4,222 60
Businesses acquired exclusively with a view to disposal
Loss after tax (251) (136)
Profit/(loss) from discontinued operations, net of tax 3,971 (76)
Discontinued operations reflect the results of Banco Real sold to Santander on 24 July 2008. There were no discontinued operations during 2006.
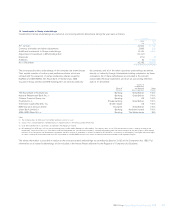
Businesses acquired exclusively with a view to disposal comprise those
ABN AMRO businesses, including Banca Antonveneta, Asset
Management and Private Equity, classified as disposal groups on the
acquisition of ABN AMRO on 17 October 2007. The Asset Management
business was sold to Fortis on 3 April 2008. Banca Antonveneta,
excluding its subsidiary Interbanca, was sold to Banca Monte dei
Paschi di Siena S.p.A. on 30 May 2008.
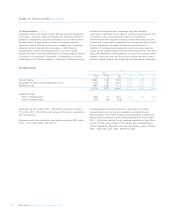
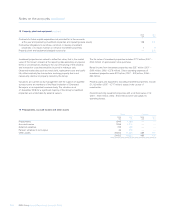
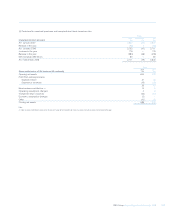
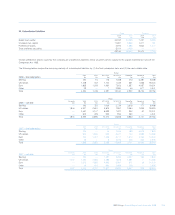
(b) Cash flows attributable to discontinued operations
Included within the Group’s cash flows are the following amounts attributable to discounted operations:
2008 2007
£m £m
Net cash flows from operating activities (124) (1,304)
Net cash flows from investing activities (368) 4,341
Net cash flows from financing activities 339 (25)
Net increase in cash and cash equivalents 287 3,172
(c) Assets and liabilities of disposal groups
2008 2007
£m £m
Assets of disposal groups
Disposal groups and other disposals 66 395
Assets acquired exclusively with a view to disposal 1,515 45,455
1,581 45,850
Liabilities of disposal groups
Liabilities acquired exclusively with a view to disposal 859 29,228