RBS 2008 Annual Report Download - page 275
Download and view the complete annual report
Please find page 275 of the 2008 RBS annual report below. You can navigate through the pages in the report by either clicking on the pages listed below, or by using the keyword search tool below to find specific information within the annual report.-
 1
1 -
2
-
3
-
4
-
5
-
6
-
7
-
8
-
9
-
10
-
11
-
12
-
13
-
14
-
15
-
16
-
17
-
18
-
19
-
20
-
21
-
22
-
23
-
24
-
25
-
26
-
27
-
28
-
29
-
30
-
31
-
32
-
33
-
34
-
35
-
36
-
37
-
38
-
39
-
40
-
41
-
42
-
43
-
44
-
45
-
46
-
47
-
48
-
49
-
50
-
51
-
52
-
53
-
54
-
55
-
56
-
57
-
58
-
59
-
60
-
61
-
62
-
63
-
64
-
65
-
66
-
67
-
68
-
69
-
70
-
71
-
72
-
73
-
74
-
75
-
76
-
77
-
78
-
79
-
80
-
81
-
82
-
83
-
84
-
85
-
86
-
87
-
88
-
89
-
90
-
91
-
92
-
93
-
94
-
95
-
96
-
97
-
98
-
99
-
100
-
101
-
102
-
103
-
104
-
105
-
106
-
107
-
108
-
109
-
110
-
111
-
112
-
113
-
114
-
115
-
116
-
117
-
118
-
119
-
120
-
121
-
122
-
123
-
124
-
125
-
126
-
127
-
128
-
129
-
130
-
131
-
132
-
133
-
134
-
135
-
136
-
137
-
138
-
139
-
140
-
141
-
142
-
143
-
144
-
145
-
146
-
147
-
148
-
149
-
150
-
151
-
152
-
153
-
154
-
155
-
156
-
157
-
158
-
159
-
160
-
161
-
162
-
163
-
164
-
165
-
166
-
167
-
168
-
169
-
170
-
171
-
172
-
173
-
174
-
175
-
176
-
177
-
178
-
179
-
180
-
181
-
182
-
183
-
184
-
185
-
186
-
187
-
188
-
189
-
190
-
191
-
192
-
193
-
194
-
195
-
196
-
197
-
198
-
199
-
200
-
201
-
202
-
203
-
204
-
205
-
206
-
207
-
208
-
209
-
210
-
211
-
212
-
213
-
214
-
215
-
216
-
217
-
218
-
219
-
220
-
221
-
222
-
223
-
224
-
225
-
226
-
227
-
228
-
229
-
230
-
231
-
232
-
233
-
234
-
235
-
236
-
237
-
238
-
239
-
240
-
241
-
242
-
243
-
244
-
245
-
246
-
247
-
248
-
249
-
250
-
251
-
252
-
253
-
254
-
255
-
256
-
257
-
258
-
259
-
260
-
261
-
262
-
263
-
264
-
 265
265 -
 266
266 -
 267
267 -
 268
268 -
 269
269 -
 270
270 -
 271
271 -
 272
272 -
 273
273 -
 274
274 -
 275
275 -
 276
276 -
 277
277 -
 278
278 -
 279
279 -
 280
280 -
 281
281 -
 282
282 -
 283
283 -
 284
284 -
 285
285 -
286
-
287
-
288
-
289
-
290
-
291
-
292
-
293
-
294
-
295
-
296
-
297
-
298
-
299
 |
 |

RBS Group Annual Report and Accounts 2008274
Additional information continued
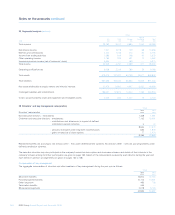
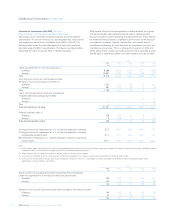
IFRS
2008 2007 2006 2005 2004
£m £m £m £m £m
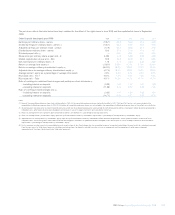
Loans accounted for on a non-accrual basis (2):
Domestic 8,588 5,599 5,420 4,977 3,658
Foreign 10,891 4,763 812 949 1,075
Total 19,479 10,362 6,232 5,926 4,733
Accruing loans which are contractually overdue
90 days or more as to principal or interest (3):
Domestic 1,201 217 81 2 634
Foreign 581 152 24 7 79
Total 1,782 369 105 9 713
Loans not included above which are classified as
‘troubled debt restructurings’ by the SEC:
Domestic — —— 214
Foreign — ———10
Total — —— 224
Total risk elements in lending 21,261 10,731 6,337 5,937 5,470
Potential problem loans (4)
Domestic 218 63 47 14 173
Foreign 8 608 55107
Total potential problem loans 226 671 52 19 280
Closing provisions for impairment as a % of total risk elements in lending 52% 60% 62% 65% 76%
Closing provisions for impairment as a % of total risk elements in lending
and potential problem loans 51% 57% 62% 65% 72%
Risk elements in lending as a % of gross lending to customers excluding
reverse repos 2.51% 1.55% 1.55% 1.60% 1.83%
Notes:
(1) For the analysis above, ‘Domestic’ consists of the United Kingdom domestic transactions of the Group. ‘Foreign’ comprises the Group’s transactions conducted through offices outside the UK and
through those offices in the UK specifically organised to service international banking transactions.
(2) All loans against which an impairment provision is held are reported in the non-accrual category.
(3) Loans where an impairment event has taken place but no impairment recognised. This category is used for fully collateralised non-revolving credit facilities.
(4) Loans for which an impairment event has occurred but no impairment provision is necessary. This category is used for fully collateralised advances and revolving credit facilities where
identification as 90 days overdue is not feasible.
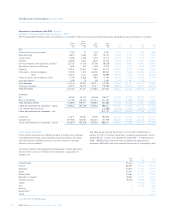
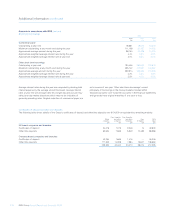
IFRS
2008 2007 2006 2005 2004
£m £m £m £m £m
Gross income not recognised but which would have been recognised
under the original terms of non-accrual and restructured loans:
Domestic 393 390 370 334 235
Foreign 342 155 77 62 58
735 545 447 396 293
Interest on non-accrual and restructured loans included in net interest income:
Domestic 150 165 142 130 58
Foreign 43 16 15 14 7
193 181 157 144 65
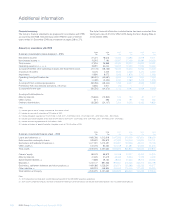
Amounts in accordance with IFRS (continued)
Risk elements in lending and potential problem loans
The Group’s loan control and review procedures do not include the
classification of loans as non-accrual, accruing past due, restructured
and potential problem loans, as defined by the SEC in the US. The
following table shows the estimated amount of loans that would be
reported using the SEC’s classifications. The figures are stated before
deducting the value of security held or related provisions.
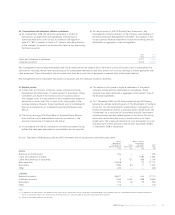
IFRS require interest to be recognised on a financial asset (or a group
of financial assets) after impairment at the rate of interest used to
discount recoveries when measuring the impairment loss. Thus, interest
on impaired financial assets is credited to profit or loss as the discount
on expected recoveries unwinds. Despite this, such assets are not
considered performing. All loans that have an impairment provision are
classified as non-accrual. This is a change from practice in 2004 and
earlier years where certain loans with provisions were classified as past
due 90 days or potential problem loans (and interest accrued on them).