RBS 2008 Annual Report Download - page 216
Download and view the complete annual report
Please find page 216 of the 2008 RBS annual report below. You can navigate through the pages in the report by either clicking on the pages listed below, or by using the keyword search tool below to find specific information within the annual report.-
 1
1 -
2
-
3
-
4
-
5
-
6
-
7
-
8
-
9
-
10
-
11
-
12
-
13
-
14
-
15
-
16
-
17
-
18
-
19
-
20
-
21
-
22
-
23
-
24
-
25
-
26
-
27
-
28
-
29
-
30
-
31
-
32
-
33
-
34
-
35
-
36
-
37
-
38
-
39
-
40
-
41
-
42
-
43
-
44
-
45
-
46
-
47
-
48
-
49
-
50
-
51
-
52
-
53
-
54
-
55
-
56
-
57
-
58
-
59
-
60
-
61
-
62
-
63
-
64
-
65
-
66
-
67
-
68
-
69
-
70
-
71
-
72
-
73
-
74
-
75
-
76
-
77
-
78
-
79
-
80
-
81
-
82
-
83
-
84
-
85
-
86
-
87
-
88
-
89
-
90
-
91
-
92
-
93
-
94
-
95
-
96
-
97
-
98
-
99
-
100
-
101
-
102
-
103
-
104
-
105
-
106
-
107
-
108
-
109
-
110
-
111
-
112
-
113
-
114
-
115
-
116
-
117
-
118
-
119
-
120
-
121
-
122
-
123
-
124
-
125
-
126
-
127
-
128
-
129
-
130
-
131
-
132
-
133
-
134
-
135
-
136
-
137
-
138
-
139
-
140
-
141
-
142
-
143
-
144
-
145
-
146
-
147
-
148
-
149
-
150
-
151
-
152
-
153
-
154
-
155
-
156
-
157
-
158
-
159
-
160
-
161
-
162
-
163
-
164
-
165
-
166
-
167
-
168
-
169
-
170
-
171
-
172
-
173
-
174
-
175
-
176
-
177
-
178
-
179
-
180
-
181
-
182
-
183
-
184
-
185
-
186
-
187
-
188
-
189
-
190
-
191
-
192
-
193
-
194
-
195
-
196
-
197
-
198
-
199
-
200
-
201
-
202
-
203
-
204
-
205
-
 206
206 -
 207
207 -
 208
208 -
 209
209 -
 210
210 -
 211
211 -
 212
212 -
 213
213 -
 214
214 -
 215
215 -
 216
216 -
 217
217 -
 218
218 -
 219
219 -
 220
220 -
 221
221 -
 222
222 -
 223
223 -
 224
224 -
 225
225 -
 226
226 -
227
-
228
-
229
-
230
-
231
-
232
-
233
-
234
-
235
-
236
-
237
-
238
-
239
-
240
-
241
-
242
-
243
-
244
-
245
-
246
-
247
-
248
-
249
-
250
-
251
-
252
-
253
-
254
-
255
-
256
-
257
-
258
-
259
-
260
-
261
-
262
-
263
-
264
-
265
-
266
-
267
-
268
-
269
-
270
-
271
-
272
-
273
-
274
-
275
-
276
-
277
-
278
-
279
-
280
-
281
-
282
-
283
-
284
-
285
-
286
-
287
-
288
-
289
-
290
-
291
-
292
-
293
-
294
-
295
-
296
-
297
-
298
-
299
 |
 |

215RBS Group Annual Report and Accounts 2008
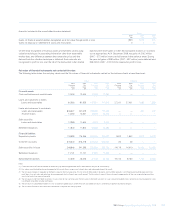
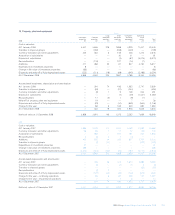
Group
2008 2007
Notional Notional
amounts Assets Liabilities amounts Assets Liabilities
£bn £m £m £bn £m £m
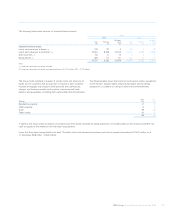
Exchange rate contracts
Spot, forwards and futures 2,316 83,065 83,568 2,134 29,829 29,629
Currency swaps 1,074 53,398 54,728 887 14,785 13,789
Options purchased 616 36,762 — 488 13,750 —
Options written 668 — 35,017 519 — 13,892
Interest rate contracts
Interest rate swaps 37,901 548,040 532,180 24,798 142,470 141,479
Options purchased 5,673 99,192 — 4,084 30,681 —
Options written 3,775 — 102,216 3,640 — 31,199
Futures and forwards 8,555 7,600 6,620 3,164 807 987
Credit derivatives 2,208 142,366 132,734 2,402 34,123 29,855
Equity and commodity contracts 622 22,136 24,301 281 10,957 11,222
992,559 971,364 277,402 272,052
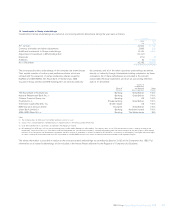
Certain derivative asset and liability balances with the London Clearing House, which meet the offset criteria in IAS 32 ‘Financial Instruments
Presentation’, are now shown net. Comparative figures have been restated, reducing derivative assets and liabilities at 31 December 2007 by £60,008
million.
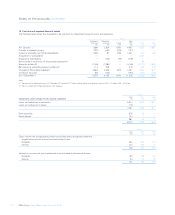
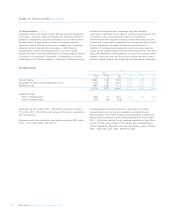
Included above are derivatives held for hedging purposes as follows:
2008 2007
Assets Liabilities Assets Liabilities
£m £m £m £m
Fair value hedging:
Exchange rate contracts 1,257 1,412 62 344
Interest rate contracts 2,944 3,330 1,598 1,062
Cash flow hedging:
Exchange rate contracts 2 90 155 78
Interest rate contracts 2,503 2,834 738 1,014
Commodity contracts 39 14 ——
Net investment hedging:
Exchange rate contracts 114 596 — 211
Hedge ineffectiveness recognised in other operating income comprised:
2008 2007 2006
£m £m £m
Fair value hedging:
(Losses)/gains on the hedged items attributable to the hedged risk (965) 81 219
Gains/(losses) on the hedging instruments 884 (87) (215)
Fair value ineffectiveness (81) (6) 4
Cash flow hedging ineffectiveness (16) 94
(97) 38