RBS 2008 Annual Report Download - page 39
Download and view the complete annual report
Please find page 39 of the 2008 RBS annual report below. You can navigate through the pages in the report by either clicking on the pages listed below, or by using the keyword search tool below to find specific information within the annual report.-
 1
1 -
2
-
3
-
4
-
5
-
6
-
7
-
8
-
9
-
10
-
11
-
12
-
13
-
14
-
15
-
16
-
17
-
18
-
19
-
20
-
21
-
22
-
23
-
24
-
25
-
26
-
27
-
28
-
 29
29 -
 30
30 -
 31
31 -
 32
32 -
 33
33 -
 34
34 -
 35
35 -
 36
36 -
 37
37 -
 38
38 -
 39
39 -
 40
40 -
 41
41 -
 42
42 -
 43
43 -
 44
44 -
 45
45 -
 46
46 -
 47
47 -
 48
48 -
 49
49 -
50
-
51
-
52
-
53
-
54
-
55
-
56
-
57
-
58
-
59
-
60
-
61
-
62
-
63
-
64
-
65
-
66
-
67
-
68
-
69
-
70
-
71
-
72
-
73
-
74
-
75
-
76
-
77
-
78
-
79
-
80
-
81
-
82
-
83
-
84
-
85
-
86
-
87
-
88
-
89
-
90
-
91
-
92
-
93
-
94
-
95
-
96
-
97
-
98
-
99
-
100
-
101
-
102
-
103
-
104
-
105
-
106
-
107
-
108
-
109
-
110
-
111
-
112
-
113
-
114
-
115
-
116
-
117
-
118
-
119
-
120
-
121
-
122
-
123
-
124
-
125
-
126
-
127
-
128
-
129
-
130
-
131
-
132
-
133
-
134
-
135
-
136
-
137
-
138
-
139
-
140
-
141
-
142
-
143
-
144
-
145
-
146
-
147
-
148
-
149
-
150
-
151
-
152
-
153
-
154
-
155
-
156
-
157
-
158
-
159
-
160
-
161
-
162
-
163
-
164
-
165
-
166
-
167
-
168
-
169
-
170
-
171
-
172
-
173
-
174
-
175
-
176
-
177
-
178
-
179
-
180
-
181
-
182
-
183
-
184
-
185
-
186
-
187
-
188
-
189
-
190
-
191
-
192
-
193
-
194
-
195
-
196
-
197
-
198
-
199
-
200
-
201
-
202
-
203
-
204
-
205
-
206
-
207
-
208
-
209
-
210
-
211
-
212
-
213
-
214
-
215
-
216
-
217
-
218
-
219
-
220
-
221
-
222
-
223
-
224
-
225
-
226
-
227
-
228
-
229
-
230
-
231
-
232
-
233
-
234
-
235
-
236
-
237
-
238
-
239
-
240
-
241
-
242
-
243
-
244
-
245
-
246
-
247
-
248
-
249
-
250
-
251
-
252
-
253
-
254
-
255
-
256
-
257
-
258
-
259
-
260
-
261
-
262
-
263
-
264
-
265
-
266
-
267
-
268
-
269
-
270
-
271
-
272
-
273
-
274
-
275
-
276
-
277
-
278
-
279
-
280
-
281
-
282
-
283
-
284
-
285
-
286
-
287
-
288
-
289
-
290
-
291
-
292
-
293
-
294
-
295
-
296
-
297
-
298
-
299
 |
 |

RBS Group Annual Report and Accounts 200838
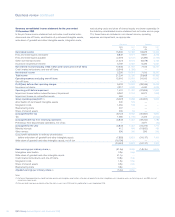
Business review continued
Write-down of goodwill and other intangible assets
After reviewing the carrying value of goodwill and other purchased
intangible assets, the Group has recorded an impairment charge of
£16,196 million, net of a tax credit of £715 million. Of this charge,
£7,678 million relates to part of the goodwill in respect of the
acquisition of ABN AMRO, while other significant impairments have
been recorded on part of the Citizens/Charter One goodwill of £4,382
million, part of the NatWest goodwill (principally allocated to Global
Banking & Markets) of £2,742 million and other goodwill of £720 million.
Other intangible asset impairments of £1,389 million principally relate to
the write-down in the value of customer relationships recognised on the
acquisition of ABN AMRO.
These impairments have no cash impact, and minimal impact on the
Group’s capital ratios.
Other non-operating items
Integration and restructuring costs totalled £1,357 million, primarily
reflecting the integration of ABN AMRO into the Group, while the
amortisation of purchased intangibles increased to £443 million from
£124 million.
Taxation
The Group recorded a tax credit of £1,280 million in 2008, compared
with a tax charge of £1,709 million in 2007.
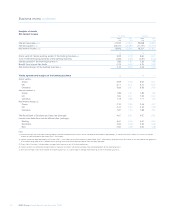
Earnings
Basic earnings per ordinary share decreased from 40.8p to (61.0p).
Adjusted earnings per ordinary share fell from 44.5p to a loss of 5.2p per
share. The number of shares in issue increased to 39,456 million at
31 December 2008, compared with 10,006 million in issue at
31 December 2007, reflecting the Group’s capital raisings in June
and December and the capitalisation issue in lieu of the interim
dividend for 2008.
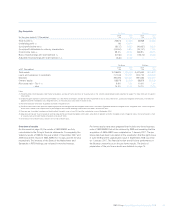
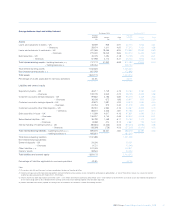
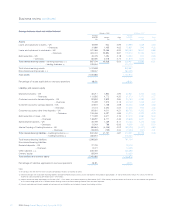
Balance sheet
Total assets of £2,218.7 billion at 31 December 2008 were up £623.6
billion, 39%, compared with 31 December 2007. At constant exchange
rates the increase was £313 billion or 16%.
Loans and advances to banks decreased by £81.6 billion, 39%, to
£129.4 billion. Reverse repurchase agreements and stock borrowing
(‘reverse repos’) were down by £115.7 billion, 66% to £58.8 billion.
Excluding reverse repos, bank placings increased by £34.1 billion, 93%,
to £70.6 billion.
Loans and advances to customers were up £31.0 billion, 4%, at £731.2
billion. Within this, reverse repos decreased by 72%, £102.8 billion to
£39.3 billion. Excluding reverse repos, lending rose by £133.8 billion,
24% to £691.9 billion reflecting both organic growth of £44.8 billion, 7%
and the effect of exchange rate movements of £89.0 billion following the
weakening of sterling during the second half of 2008.
On a proportionally consolidated basis, the Group’s Core Tier 1 ratio at
31 December 2008 was 6.1%, compared with 4.0% at 1 January 2008,
on a Basel II basis. The Tier 1 ratio was 9.9% at 31 December 2008
(6.8% at 1 January 2008) and the total capital ratio 14.2% (10.9% at
1 January 2008).